
CHAPTER 5
Mechanical Properties of Wood
David E. Kretschmann, Research General Engineer
5–1
The mechanical properties presented in this chapter were
obtained from tests of pieces of wood termed “clear” and
“straight grained” because they did not contain characteris-
tics such as knots, cross grain, checks, and splits. These test
pieces did have anatomical characteristics such as growth
rings that occurred in consistent patterns within each piece.
Clear wood specimens are usually considered “homoge-
neous” in wood mechanics.
Many of the mechanical properties of wood tabulated in this
chapter were derived from extensive sampling and analysis
procedures. These properties are represented as the aver-
age mechanical properties of the species. Some properties,
such as tension parallel to the grain, and all properties for
some imported species are based on a more limited number
of specimens that were not subjected to the same sampling
and analysis procedures. The appropriateness of these latter
properties to represent the average properties of a species
is uncertain; nevertheless, the properties represent the best
information available.
Variability, or variation in properties, is common to all
materials. Because wood is a natural material and the tree
is subject to many constantly changing inuences (such as
moisture, soil conditions, and growing space), wood proper-
ties vary considerably, even in clear material. This chapter
provides information, where possible, on the nature and
magnitude of variability in properties.
This chapter also includes a discussion of the effect of
growth features, such as knots and slope of grain, on clear
wood properties. The effects of manufacturing and service
environments on mechanical properties are discussed, and
their effects on clear wood and material containing growth
features are compared. Chapter 7 discusses how these
research results have been implemented in engineering
standards.
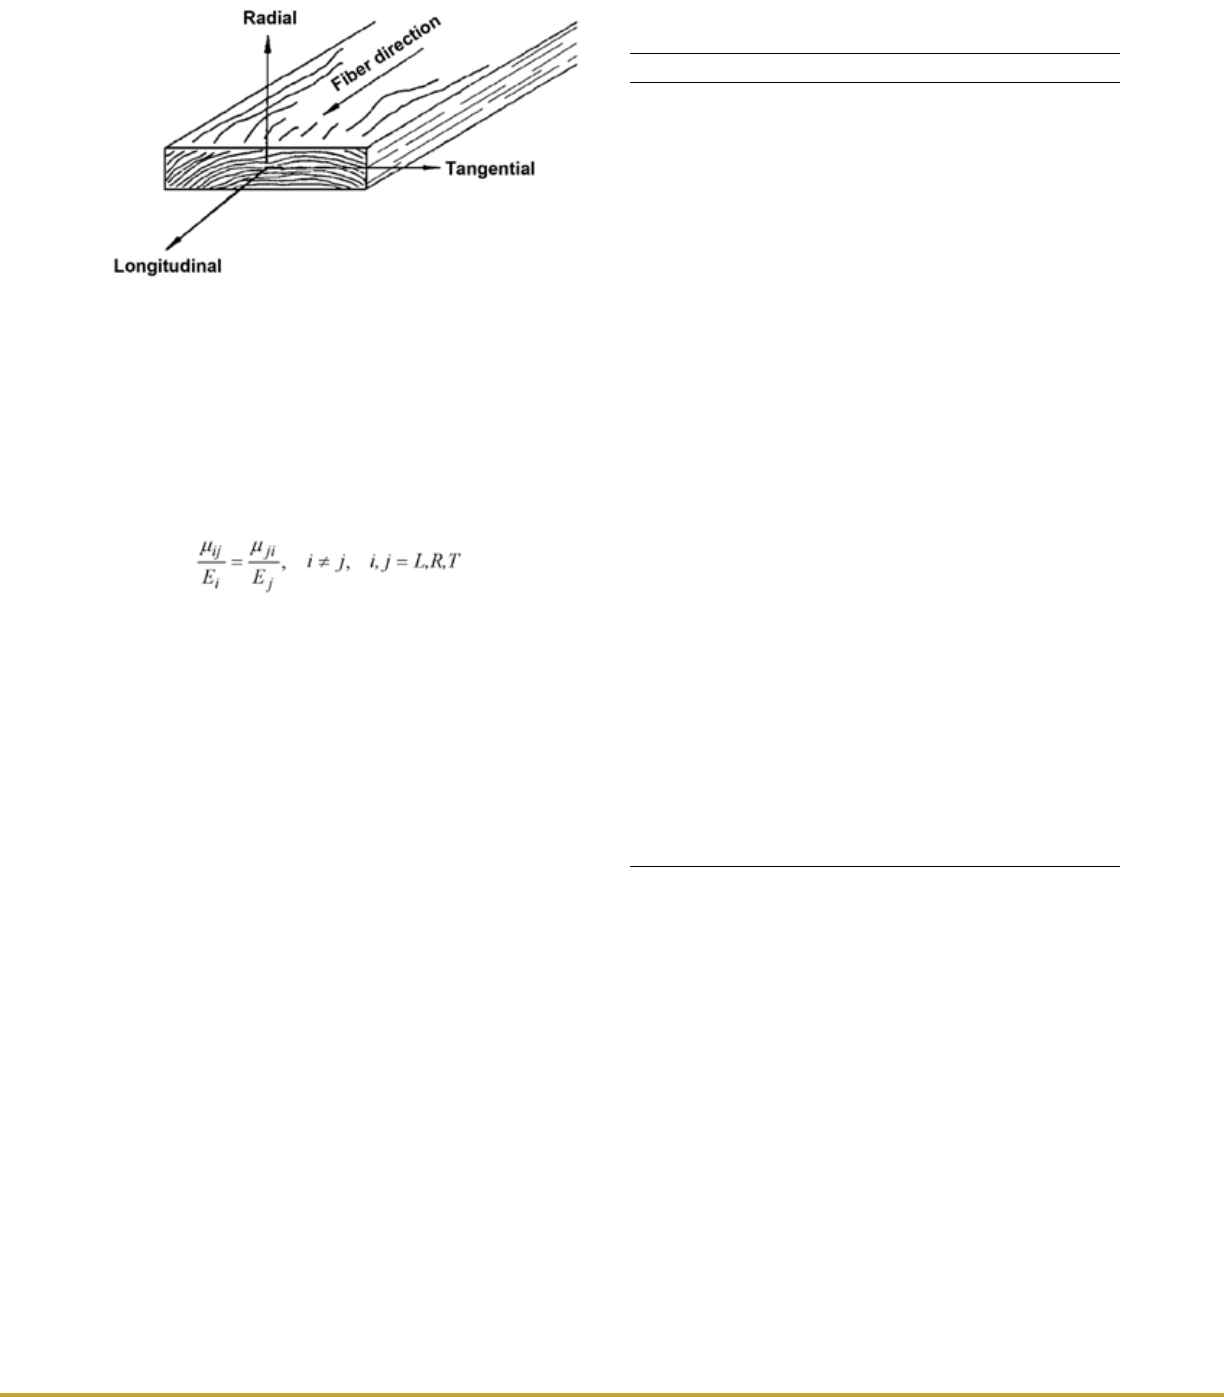
Orthotropic Nature of Wood
Wood may be described as an orthotropic material; that is,
it has unique and independent mechanical properties in the
directions of three mutually perpendicular axes: longitudi-
nal, radial, and tangential. The longitudinal axis L is parallel
to the ber (grain); the radial axis R is normal to the growth
rings (perpendicular to the grain in the radial direction); and
the tangential axis T is perpendicular to the grain but tangent
to the growth rings. These axes are shown in Figure 5–1.
Contents
Orthotropic Nature of Wood 5–1
Elastic Properties 5–2
Modulus of Elasticity 5–2
Poisson’s Ratio 5–2
Modulus of Rigidity 5–3
Strength Properties 5–3
Common Properties 5–3
Less Common Properties 5–15
Vibration Properties 5–17
Speed of Sound 5–17
Internal Friction 5–17
Mechanical Properties of Clear Straight-Grained
Wood 5–21
Natural Characteristics Affecting Mechanical
Properties 5–26
Specific Gravity 5–26
Knots 5–26
Slope of Grain 5–28
Annual Ring Orientation 5–31
Reaction Wood 5–31
Juvenile Wood 5–32
Compression Failures 5–33
Pitch Pockets 5–33
Bird Peck 5–33
Extractives 5–34
Properties of Timber from Dead Trees 5–34
Effects of Manufacturing and Service
Environments 5–34
Temperature 5–35
Time Under Load 5–38
Aging 5–41
Exposure to Chemicals 5–41
Chemical Treatment 5–41
Nuclear Radiation 5–43
Mold and Stain Fungi 5–43
Decay 5–43
Insect Damage 5–44
Literature Cited 5–44
Additional References 5–44
5–2
Elastic Properties
Twelve constants (nine are independent) are needed to de-
scribe the elastic behavior of wood: three moduli of elastic-
ity E, three moduli of rigidity G, and six Poisson’s ratios μ.
The moduli of elasticity and Poisson’s ratios are related by
expressions of the form
(5–1)
General relations between stress and strain for a homoge-
neous orthotropic material can be found in texts on
anisotropic elasticity.
Modulus of Elasticity
Elasticity implies that deformations produced by low stress
are completely recoverable after loads are removed. When
loaded to higher stress levels, plastic deformation or failure
occurs. The three moduli of elasticity, which are denoted
by E
L
, E
R
, and E
T
, respectively, are the elastic moduli along
the longitudinal, radial, and tangential axes of wood. These
moduli are usually obtained from compression tests; how-
ever, data for E
R
and E
T
are not extensive. Average values
of E
R
and E
T
for samples from a few species are presented in
Table 5–1 as ratios with E
L
; the Poisson’s ratios are shown
in Table 5–2. The elastic ratios, and the elastic constants
themselves, vary within and between species and with mois-
ture content and specic gravity.
The modulus of elasticity determined from bending, E
L
,
rather than from an axial test, may be the only modulus of
elasticity available for a species. Average E
L
values obtained
from bending tests are given in Tables 5–3 to 5–5. Repre-
sentative coefcients of variation of E
L
determined with
bending tests for clear wood are reported in Table 5–6. As
tabulated, E
L
includes an effect of shear deection; E
L
from
bending can be increased by 10% to remove this effect ap-
proximately. This adjusted bending E
L
can be used to deter-
mine E
R
and E
T
based on the ratios in Table 5–1.
Poisson’s Ratio
When a member is loaded axially, the deformation perpen-
dicular to the direction of the load is proportional to the
deformation parallel to the direction of the load. The ratio
of the transverse to axial strain is called Poisson’s ratio.
The Poisson’s ratios are denoted by μ
LR
, μ
RL
, μ
LT
, μ
TL
, μ
RT
,
and μ
TR
. The rst letter of the subscript refers to direction
of applied stress and the second letter to direction of lateral
deformation. For example, μ
LR
is the Poisson’s ratio for
deformation along the radial axis caused by stress along
the longitudinal axis. Average values of experimentally de-
termined Poisson’s ratios for samples of a few species are
given in Table 5–2. The ideal relationship between Poisson’s
ratio and the moduli of elasticity given in Equation (5–1) are
not always closely met. Two of the Poisson’s ratios, μ
RL
and
μ
TL
, are very small and are less precisely determined than
are those for other Poisson’s ratios. Poisson’s ratios vary
within and between species and are affected by moisture
content and specic gravity.
Figure 5–1. Three principal axes of wood with respect to
grain direction and growth rings.
Table 5–1. Elastic ratios for various species at
approximately 12% moisture content
a
Species E
T
/E
L
E
R
/E
L
G
LR
/E
L
G
LT
/E
L
G
RT
/E
L
Hardwoods
Ash, white 0.080 0.125 0.109 0.077 —
Balsa 0.015 0.046 0.054 0.037 0.005
Basswood 0.027 0.066 0.056 0.046 —
Birch, yellow 0.050 0.078 0.074 0.068 0.017
Cherry, black 0.086 0.197 0.147 0.097 —
Cottonwood, eastern 0.047 0.083 0.076 0.052 —
Mahogany, African 0.050 0.111 0.088 0.059 0.021
Mahogany, Honduras 0.064 0.107 0.066 0.086 0.028
Maple, sugar 0.065 0.132 0.111 0.063 —
Maple, red 0.067 0.140 0.133 0.074 —
Oak, red 0.082 0.154 0.089 0.081 —
Oak, white 0.072 0.163 0.086 — —
Sweetgum 0.050 0.115 0.089 0.061 0.021
Walnut, black 0.056 0.106 0.085 0.062 0.021
Yellow-poplar 0.043 0.092 0.075 0.069 0.011
Softwoods
Baldcypress 0.039 0.084 0.063 0.054 0.007
Cedar, northern white 0.081 0.183 0.210 0.187 0.015
Cedar, western red 0.055 0.081 0.087 0.086 0.005
Douglas-fir 0.050 0.068 0.064 0.078 0.007
Fir, subalpine 0.039 0.102 0.070 0.058 0.006
Hemlock, western 0.031 0.058 0.038 0.032 0.003
Larch, western 0.065 0.079 0.063 0.069 0.007
Pine
Loblolly 0.078 0.113 0.082 0.081 0.013
Lodgepole 0.068 0.102 0.049 0.046 0.005
Longleaf 0.055 0.102 0.071 0.060 0.012
Pond 0.041 0.071 0.050 0.045 0.009
Ponderosa 0.083 0.122 0.138 0.115 0.017
Red 0.044 0.088 0.096 0.081 0.011
Slash 0.045 0.074 0.055 0.053 0.010
Sugar 0.087 0.131 0.124 0.113 0.019
Western white 0.038 0.078 0.052 0.048 0.005
Redwood 0.089 0.087 0.066 0.077 0.011
Spruce, Sitka 0.043 0.078 0.064 0.061 0.003
Spruce, Engelmann 0.059 0.128 0.124 0.120 0.010
a
E
L
may be approximated by increasing modulus of elasticity values in
Table 5–3 by 10%.
General Technical Report FPL–GTR–190

5–3
Chapter 5 Mechanical Properties of Wood
Modulus of Rigidity
The modulus of rigidity, also called shear modulus, indi-
cates the resistance to deection of a member caused by
shear stresses. The three moduli of rigidity denoted by G
LR
,
G
LT
, and G
RT
are the elastic constants in the LR, LT, and
RT planes, respectively. For example, G
LR
is the modulus
of rigidity based on shear strain in the LR plane and shear
stresses in the LT and RT planes. Average values of shear
moduli for samples of a few species expressed as ratios with
E
L
are given in Table 5–1. As with moduli of elasticity, the
moduli of rigidity vary within and between species and
with moisture content and specic gravity.
Strength Properties
Common Properties
Mechanical properties most commonly measured and repre-
sented as “strength properties” for design include modulus
of rupture in bending, maximum stress in compression par-
allel to grain, compressive stress perpendicular to grain, and
shear strength parallel to grain. Additional measurements
are often made to evaluate work to maximum load in bend-
ing, impact bending strength, tensile strength perpendicular
to grain, and hardness. These properties, grouped according
to the broad forest tree categories of hardwood and soft-
wood (not correlated with hardness or softness), are given in
Tables 5–3 to 5–5 for many of the commercially important
species. Average coefcients of variation for these proper-
ties from a limited sampling of specimens are reported in
Table 5–6.
Modulus of rupture—Reects the maximum load-carrying
capacity of a member in bending and is proportional to max-
imum moment borne by the specimen. Modulus of rupture
is an accepted criterion of strength, although it is not a true
stress because the formula by which it is computed is valid
only to the elastic limit.
Work to maximum load in bending—Ability to absorb
shock with some permanent deformation and more or less
injury to a specimen. Work to maximum load is a measure
of the combined strength and toughness of wood under
bending stresses.
Compressive strength parallel to grain—Maximum stress
sustained by a compression parallel-to-grain specimen hav-
ing a ratio of length to least dimension of less than 11.
Compressive stress perpendicular to grain—Reported as
stress at proportional limit. There is no clearly dened ulti-
mate stress for this property.
Shear strength parallel to grain—Ability to resist internal
slipping of one part upon another along the grain. Values
presented are average strength in radial and tangential shear
planes.
Impact bending—In the impact bending test, a hammer of
given weight is dropped upon a beam from successively in-
creased heights until rupture occurs or the beam deects
152 mm (6 in.) or more. The height of the maximum drop,
or the drop that causes failure, is a comparative value that
represents the ability of wood to absorb shocks that cause
stresses beyond the proportional limit.
Tensile strength perpendicular to grain—Resistance of
wood to forces acting across the grain that tend to split a
member. Values presented are the average of radial and
tangential observations.
Hardness—Generally dened as resistance to indentation
using a modied Janka hardness test, measured by the load
required to embed a 11.28-mm (0.444-in.) ball to one-half
its diameter. Values presented are the average of radial and
tangential penetrations.
Tensile strength parallel to grain—Maximum tensile
stress sustained in direction parallel to grain. Relatively few
data are available on the tensile strength of various species
Table 5–2. Poisson’s ratios for various species at
approximately 12% moisture content
Species µ
LR
µ
LT
µ
RT
µ
TR
µ
RL
µ
TL
Hardwoods
Ash, white 0.371 0.440 0.684 0.360 0.059 0.051
Aspen, quaking 0.489 0.374 — 0.496 0.054 0.022
Balsa 0.229 0.488 0.665 0.231 0.018 0.009
Basswood 0.364 0.406 0.912 0.346 0.034 0.022
Birch, yellow 0.426 0.451 0.697 0.426 0.043 0.024
Cherry, black 0.392 0.428 0.695 0.282 0.086 0.048
Cottonwood, eastern 0.344 0.420 0.875 0.292 0.043 0.018
Mahogany, African 0.297 0.641 0.604 0.264 0.033 0.032
Mahogany, Honduras 0.314 0.533 0.600 0.326 0.033 0.034
Maple, sugar 0.424 0.476 0.774 0.349 0.065 0.037
Maple, red 0.434 0.509 0.762 0.354 0.063 0.044
Oak, red 0.350 0.448 0.560 0.292 0.064 0.033
Oak, white 0.369 0.428 0.618 0.300 0.074 0.036
Sweetgum 0.325 0.403 0.682 0.309 0.044 0.023
Walnut, black 0.495 0.632 0.718 0.367 0.052 0.036
Yellow-poplar 0.318 0.392 0.703 0.329 0.030 0.019
Softwoods
Baldcypress 0.338 0.326 0.411 0.356 — —
Cedar, northern white 0.337 0.340 0.458 0.345 — —
Cedar, western red 0.378 0.296 0.484 0.403 — —
Douglas-fir 0.292 0.449 0.390 0.374 0.036 0.029
Fir, subalpine 0.341 0.332 0.437 0.336 — —
Hemlock, western 0.485 0.423 0.442 0.382 — —
Larch, western 0.355 0.276 0.389 0.352 — —
Pine
Loblolly 0.328 0.292 0.382 0.362 — —
Lodgepole 0.316 0.347 0.469 0.381 — —
Longleaf 0.332 0.365 0.384 0.342 — —
Pond 0.280 0.364 0.389 0.320 — —
Ponderosa 0.337 0.400 0.426 0.359 — —
Red 0.347 0.315 0.408 0.308 — —
Slash 0.392 0.444 0.447 0.387 — —
Sugar 0.356 0.349 0.428 0.358 — —
Western white 0.329 0.344 0.410 0.334 — —
Redwood 0.360 0.346 0.373 0.400 — —
Spruce, Sitka 0.372 0.467 0.435 0.245 0.040 0.025
Spruce, Engelmann 0.422 0.462 0.530 0.255 0.083 0.058

5–4
Errata, 2018: Corrected MOR value for 12% MC white ash.
Table 5–3a. Strength properties of some commercially important woods grown in the United States (metric)
a
Static bending
Impact
bending
(mm)
Com-
pression
parallel
to grain
(kPa)
Com-
pression
perpen-
dicular
to grain
(kPa)
Shear
parallel
to
grain
(kPa)
Tension
perpen-
dicular
to grain
(kPa)
Side
hard-
ness
(N)
Modulus
of
rupture
(kPa)
Modulus
of
elasticity
c
(MPa)
Work to
maxi-
mum
load
(kJ m
–3
)
Common species
names
Moisture
content
Specific
gravity
b
Hardwoods
Alder, red Green 0.37 45,000 8,100 55 560 20,400 1,700 5,300 2,700 2,000
12% 0.41 68,000 9,500 58 510 40,100 3,000 7,400 2,900 2,600
Ash
Black Green 0.45 41,000 7,200 83 840 15,900 2,400 5,900 3,400 2,300
12% 0.49 87,000 11,000 103 890 41,200 5,200 10,800 4,800 3,800
Blue Green 0.53 66,000 8,500 101 — 28,800 5,600 10,600 — —
12% 0.58 95,000 9,700 99 — 48,100 9,800 14,000 — —
Green Green 0.53 66,000 9,700 81 890 29,000 5,000 8,700 4,100 3,900
12% 0.56 97,000 11,400 92 810 48,800 9,000 13,200 4,800 5,300
Oregon Green 0.50 52,000 7,800 84 990 24,200 3,700 8,200 4,100 3,500
12% 0.55 88,000 9,400 99 840 41,600 8,600 12,300 5,000 5,200
White Green 0.55 66,000 9,900 108 970 27,500 4,600 9,300 4,100 4,300
12% 0.60
10
6,000 12,000 115 1,090 51,100 8,000 13,200 6,500 5,900
Aspen
Bigtooth Green 0.36 37,000 7,700 39 — 17,200 1,400 5,000 — —
12% 0.39 63,000 9,900 53 — 36,500 3,100 7,400 — —
Quaking Green 0.35 35,000 5,900 44 560 14,800 1,200 4,600 1,600 1,300
12% 0.38 58,000 8,100 52 530 29,300 2,600 5,900 1,800 1,600
Basswood, American Green 0.32 34,000 7,200 37 410 15,300 1,200 4,100 1,900 1,100
12% 0.37 60,000 10,100 50 410 32,600 2,600 6,800 2,400 1,800
Beech, American Green 0.56 59,000 9,500 82 1,090 24,500 3,700 8,900 5,000 3,800
12% 0.64 103,000 11,900 104 1,040 50,300 7,000 13,900 7,000 5,800
Birch
Paper Green 0.48 44,000 8,100 112 1,240 16,300 1,900 5,800 2,600 2,500
12% 0.55 85,000 11,000 110 860 39,200 4,100 8,300 — 4,000
Sweet Green 0.60 65,000 11,400 108 1,220 25,800 3,200 8,500 3,000 4,300
12% 0.65 117,000 15,000 124 1,190 58,900 7,400 15,400 6,600 6,500
Yellow Green 0.55 57,000 10,300 111 1,220 23,300 3,000 7,700 3,000 3,600
12% 0.62 114,000 13,900 143 1,400 56,300 6,700 13,000 6,300 5,600
Butternut Green 0.36 37,000 6,700 57 610 16,700 1,500 5,200 3,000 1,700
12% 0.38 56,000 8,100 57 610 36,200 3,200 8,100 3,000 2,200
Cherry, black Green 0.47 55,000 9,000 88 840 24,400 2,500 7,800 3,900 2,900
12% 0.50 85,000 10,300 79 740 49,000 4,800 11,700 3,900 4,200
Chestnut, American Green 0.40 39,000 6,400 48 610 17,000 2,100 5,500 3,000 1,900
12% 0.43 59,000 8,500 45 480 36,700 4,300 7,400 3,200 2,400
Cottonwood
Balsam poplar Green 0.31 27,000 5,200 29 — 11,700 1,000 3,400 — —
12% 0.34 47,000 7,600 34 — 27,700 2,100 5,400 — —
Black Green 0.31 34,000 7,400 34 510 15,200 1,100 4,200 1,900 1,100
12% 0.35 59,000 8,800 46 560 31,000 2,100 7,200 2,300 1,600
Eastern Green 0.37 37,000 7,000 50 530 15,700 1,400 4,700 2,800 1,500
12% 0.40 59,000 9,400 51 510 33,900 2,600 6,400 4,000 1,900
Elm
American Green 0.46 50,000 7,700 81 970 20,100 2,500 6,900 4,100 2,800
12% 0.50 81,000 9,200 90 990 38,100 4,800 10,400 4,600 3,700
Rock Green 0.57 66,000 8,200 137 1,370 26,100 4,200 8,800 — —
12% 0.63 102,000 10,600 132 1,420 48,600 8,500 13,200 — —
Slippery Green 0.48 55,000 8,500 106 1,190 22,900 2,900 7,700 4,400 2,900
12% 0.53 90,000 10,300 117 1,140 43,900 5,700 11,200 3,700 3,800
Hackberry Green 0.49 45,000 6,600 100 1,220 18,300 2,800 7,400 4,300 3,100
12% 0.53 76,000 8,200 88 1,090 37,500 6,100 11,000 4,000 3,900
General Technical Report FPL–GTR–190

5–5
Chapter 5 Mechanical Properties of Wood
Table 5–3a. Strength properties of some commercially important woods grown in the United States (metric)
a
—con.
Static bending
Impact
bending
(mm)
Com-
pression
parallel
to grain
(kPa)
Com-
pression
perpen-
dicular
to grain
(kPa)
Shear
parallel
to
grain
(kPa)
Tension
perpen-
dicular to
grain
(kPa)
Side
hard-
ness
(N)
Modulus
of
rupture
(kPa)
Modulus
of
elasticity
c
(MPa)
Work to
maxi-
mum
load
(kJ m
–3
)
Common species
names
Moisture
content
Specific
gravity
b
Hickory, pecan
Bitternut Green 0.60 71,000 9,700 138 1,680 31,500 5,500 8,500 — —
12% 0.66 118,000 12,300 125 1,680 62,300 11,600 — — —
Nutmeg Green 0.56 63,000 8,900 157 1,370 27,400 5,200 7,100 — —
12% 0.60 114,000 11,700 173 — 47,600 10,800 — — —
Pecan Green 0.60 68,000 9,400 101 1,350 27,500 5,400 10,200 4,700 5,800
12% 0.66 94,000 11,900 95 1,120 54,100 11,900 14,300 — 8,100
Water Green 0.61 74,000 10,800 130 1,420 32,100 6,100 9,900 — —
12% 0.62 123,000 13,900 133 1,350 59,300 10,700 — — —
Hickory, true
d
Mockernut Green 0.64 77,000 10,800 180 2,240 30,900 5,600 8,800 — 6,400
12% 0.72 132,000 15,300 156 1,960 61,600 11,900 12,000 — 8,800
Pignut Green 0.66 81,000 11,400 219 2,260 33,200 6,300 9,400 — 6,800
12% 0.75 139,000 15,600 210 1,880 63,400 13,700 14,800 — 9,500
Shagbark Green 0.64 76,000 10,800 163 1,880 31,600 5,800 10,500 — 6,500
12% 0.72 139,000 14,900 178 1,700 63,500 12,100 16,800 — 8,400
Shellbark Green 0.62 72,000 9,200 206 2,640 27,000 5,600 8,200 — 7,400
12% 0.69 125,000 13,000 163 2,240 55,200 12,400 14,500 — 8,100
Honeylocust Green 0.60 70,000 8,900 87 1,190 30,500 7,900 11,400 6,400 6,200
12% — 101,000 11,200 92 1,190 51,700 12,700 15,500 6,200 7,000
Locust, black Green 0.66 95,000 12,800 106 1,120 46,900 8,000 12,100 5,300 7,000
12% 0.69 134,000 14,100 127 1,450 70,200 12,600 17,100 4,400 7,600
Magnolia
Cucumbertree Green 0.44 51,000 10,800 69 760 21,600 2,300 6,800 3,000 2,300
12% 0.48 85,000 12,500 84 890 43,500 3,900 9,200 4,600 3,100
Southern Green 0.46 47,000 7,700 106 1,370 18,600 3,200 7,200 4,200 3,300
12% 0.50 77,000 9,700 88 740 37,600 5,900 10,500 5,100 4,500
Maple
Bigleaf Green 0.44 51,000 7,600 60 580 22,300 3,100 7,700 4,100 2,800
12% 0.48 74,000 10,000 54 710 41,000 5,200 11,900 3,700 3,800
Black Green 0.52 54,000 9,200 88 1,220 22,500 4,100 7,800 5,000 3,700
12% 0.57 92,000 11,200 86 1,020 46,100 7,000 12,500 4,600 5,200
Red Green 0.49 53,000 9,600 79 810 22,600 2,800 7,900 — 3,100
12% 0.54 92,000 11,300 86 810 45,100 6,900 12,800 — 4,200
Silver Green 0.44 40,000 6,500 76 740 17,200 2,600 7,200 3,900 2,600
12% 0.47 61,000 7,900 57 640 36,000 5,100 10,200 3,400 3,100
Sugar Green 0.56 65,000 10,700 92 1,020 27,700 4,400 10,100 — 4,300
12% 0.63 109,000 12,600 114 990 54,000 10,100 16,100 — 6,400
Oak, red
Black Green 0.56 57,000 8,100 84 1,020 23,900 4,900 8,400 — 4,700
12% 0.61 96,000 11,300 94 1,040 45,000 6,400 13,200 — 5,400
Cherrybark Green 0.61 74,000 12,300 101 1,370 31,900 5,200 9,100 5,500 5,500
12% 0.68 125,000 15,700 126 1,240 60,300 8,600 13,800 5,800 6,600
Laurel Green 0.56 54,000 9,600 77 990 21,900 3,900 8,100 5,300 4,400
12% 0.63 87,000 11,700 81 990 48,100 7,300 12,600 5,400 5,400
Northern red Green 0.56 57,000 9,300 91 1,120 23,700 4,200 8,300 5,200 4,400
12% 0.63 99,000 12,500 100 1,090 46,600 7,000 12,300 5,500 5,700
Pin Green 0.58 57,000 9,100 97 1,220 25,400 5,000 8,900 5,500 4,800
12% 0.63 97,000 11,900 102 1,140 47,000 7,000 14,300 7,200 6,700
Scarlet Green 0.60 72,000 10,200 103 1,370 28,200 5,700 9,700 4,800 5,300
12% 0.67 120,000 13,200 141 1,350 57,400 7,700 13,000 6,000 6,200
Southern red Green 0.52 48,000 7,900 55 740 20,900 3,800 6,400 3,300 3,800
12% 0.59 75,000 10,300 65 660 42,000 6,000 9,600 3,500 4,700
Water Green 0.56 61,000 10,700 77 990 25,800 4,300 8,500 5,700 4,500
12% 0.63 106,000 13,900 148 1,120 46,700 7,000 13,900 6,300 5,300

5–6
Table 5–3a. Strength properties of some commercially important woods grown in the United States (metric)
a
—con.
Static bending
Impact
bending
(mm)
Com-
pression
parallel
to grain
(kPa)
Com-
pression
perpen-
dicular
to grain
(kPa)
Tension
perpen-
dicular
to grain
(kPa)
Side
hard-
ness
(N)
Modulus
of
rupture
(kPa)
Modulus
of
elasticity
c
(MPa)
Work to
maxi-
mum
load
(kJ m
–3
)
Shear
parallel
to
grain
(kPa)
Common species
names
Moisture
content
Specific
gravity
b
Oak, red—con.
Willow Green 0.56 51,000 8,900 61 890 20,700 4,200 8,100 5,200 4,400
12% 0.69 100,000 13,100 101 1,070 48,500 7,800 11,400 — 6,500
Oak, white
Bur Green 0.58 50,000 6,100 74 1,120 22,700 4,700 9,300 5,500 4,900
12% 0.64 71,000 7,100 68 740 41,800 8,300 12,500 4,700 6,100
Chestnut Green 0.57 55,000 9,400 65 890 24,300 3,700 8,300 4,800 4,000
12% 0.66 92,000 11,000 76 1,020 47,100 5,800 10,300 — 5,000
Live Green 0.80 82,000 10,900 85 — 37,400 14,100 15,200 — —
12% 0.88 127,000 13,700 130 — 61,400 19,600 18,300 — —
Overcup Green 0.57 55,000 7,900 87 1,120 23,200 3,700 9,100 5,000 4,300
12% 0.63 87,000 9,800 108 970 42,700 5,600 13,800 6,500 5,300
Post Green 0.60 56,000 7,500 76 1,120 24,000 5,900 8,800 5,400 5,000
12% 0.67 91,000 10,400 91 1,170 45,300 9,900 12,700 5,400 6,000
Swamp chestnut Green 0.60 59,000 9,300 88 1,140 24,400 3,900 8,700 4,600 4,900
12% 0.67 96,000 12,200 83 1,040 50,100 7,700 13,700 4,800 5,500
Swamp white Green 0.64 68,000 11,000 100 1,270 30,100 5,200 9,000 5,900 5,200
12% 0.72 122,000 14,100 132 1,240 59,300 8,200 13,800 5,700 7,200
White Green 0.60 57,000 8,600 80 1,070 24,500 4,600 8,600 5,300 4,700
12% 0.68 105,000 12,300 102 940 51,300 7,400 13,800 5,500 6,000
Sassafras Green 0.42 41,000 6,300 49 — 18,800 2,600 6,600 — —
12% 0.46 62,000 7,700 60 — 32,800 5,900 8,500 — —
Sweetgum Green 0.46 49,000 8,300 70 910 21,000 2,600 6,800 3,700 2,700
12% 0.52 86,000 11,300 82 810 43,600 4,300 11,000 5,200 3,800
Sycamore, American Green 0.46 45,000 7,300 52 660 20,100 2,500 6,900 4,300 2,700
12% 0.49 69,000 9,800 59 660 37,100 4,800 10,100 5,000 3,400
Tanoak Green 0.58 72,000 10,700 92 — 32,100 — — — —
12% — — — — — — — — — —
Tupelo
Black Green 0.46 48,000 7,100 55 760 21,000 3,300 7,600 3,900 2,800
12% 0.50 66,000 8,300 43 560 38,100 6,400 9,200 3,400 3,600
Water Green 0.46 50,000 7,200 57 760 23,200 3,300 8,200 4,100 3,200
12% 0.50 66,000 8,700 48 580 40,800 6,000 11,000 4,800 3,900
Walnut, black Green 0.51 66,000 9,800 101 940 29,600 3,400 8,400 3,900 4,000
12% 0.55 101,000 11,600 74 860 52,300 7,000 9,400 4,800 4,500
Willow, black Green 0.36 33,000 5,400 76 — 14,100 1,200 4,700 — —
12% 0.39 54,000 7,000 61 — 28,300 3,000 8,600 — —
Yellow-poplar Green 0.40 41,000 8,400 52 660 18,300 1,900 5,400 3,500 2,000
12% 0.42 70,000 10,900 61 610 38,200 3,400 8,200 3,700 2,400
Softwoods
Baldcypress Green 0.42 46,000 8,100 46 640 24,700 2,800 5,600 2,100 1,700
12% 0.46 73,000 9,900 57 610 43,900 5,000 6,900 1,900 2,300
Cedar
Atlantic white Green 0.31 32,000 5,200 41 460 16,500 1,700 4,800 1,200 1,300
12% 0.32 47,000 6,400 28 330 32,400 2,800 5,500 1,500 1,600
Eastern redcedar Green 0.44 48,000 4,500 103 890 24,600 4,800 7,000 2,300 2,900
12% 0.47 61,000 6,100 57 560 41,500 6,300 — — 4,000
Incense Green 0.35 43,000 5,800 44 430 21,700 2,600 5,700 1,900 1,700
12% 0.37 55,000 7,200 37 430 35,900 4,100 6,100 1,900 2,100
Northern white Green 0.29 29,000 4,400 39 380 13,700 1,600 4,300 1,700 1,000
12% 0.31 45,000 5,500 33 300 27,300 2,100 5,900 1,700 1,400
General Technical Report FPL–GTR–190

Chapter 5 Mechanical Properties of Wood
5–7
Table 5–3a. Strength properties of some commercially important woods grown in the United States (metric)
a
—con.
Static bending
Impact
bending
(mm)
Com-
pression
parallel
to grain
(kPa)
Com-
pression
perpen-
dicular
to grain
(kPa)
Shear
parallel
to
grain
(kPa)
Tension
perpen-
dicular
to grain
(kPa)
Side
hard-
ness
(N)
Modulus
of
rupture
(kPa)
Modulus
of
elasticity
c
(MPa)
Work to
maxi-
mum
load
(kJ m
–3
)
Common species
names
Moisture
content
Specific
gravity
b
Cedar—con.
Port-Orford Green 0.39 45,000 9,000 51 530 21,600 2,100 5,800 1,200 1,700
12% 0.43 88,000 11,700 63 710 43,100 5,000 9,400 2,800 2,800
Western redcedar Green 0.31 35,900 6,500 34 430 19,100 1,700 5,300 1,600 1,200
12% 0.32 51,700 7,700 40 430 31,400 3,200 6,800 1,500 1,600
Yellow Green 0.42 44,000 7,900 63 690 21,000 2,400 5,800 2,300 2,000
12% 0.44 77,000 9,800 72 740 43,500 4,300 7,800 2,500 2,600
Douglas-fir
e
Coast Green 0.45 53,000 10,800 52 660 26,100 2,600 6,200 2,100 2,200
12% 0.48 85,000 13,400 68 790 49,900 5,500 7,800 2,300 3,200
Interior West Green 0.46 53,000 10,400 50 660 26,700 2,900 6,500 2,000 2,300
12% 0.50 87,000 12,600 73 810 51,200 5,200 8,900 2,400 2,900
Interior North Green 0.45 51,000 9,700 56 560 23,900 2,500 6,600 2,300 1,900
12% 0.48 90,000 12,300 72 660 47,600 5,300 9,700 2,700 2,700
Interior South Green 0.43 47,000 8,000 55 380 21,400 2,300 6,600 1,700 1,600
12% 0.46 82,000 10,300 62 510 43,000 5,100 10,400 2,300 2,300
Fir
Balsam Green 0.33 38,000 8,600 32 410 18,100 1,300 4,600 1,200 1,300
12% 0.35 63,000 10,000 35 510 36,400 2,800 6,500 1,200 1,700
California red Green 0.36 40,000 8,100 44 530 19,000 2,300 5,300 2,600 1,600
12% 0.38 72,400 10,300 61 610 37,600 4,200 7,200 2,700 2,200
Grand Green 0.35 40,000 8,600 39 560 20,300 1,900 5,100 1,700 1,600
12% 0.37 61,400 10,800 52 710 36,500 3,400 6,200 1,700 2,200
Noble Green 0.37 43,000 9,500 41 480 20,800 1,900 5,500 1,600 1,300
12% 0.39 74,000 11,900 61 580 42,100 3,600 7,200 1,500 1,800
Pacific silver Green 0.40 44,000 9,800 41 530 21,600 1,500 5,200 1,700 1,400
12% 0.43 75,800 12,100 64 610 44,200 3,100 8,400 — 1,900
Subalpine Green 0.31 34,000 7,200 — — 15,900 1,300 4,800 — 1,200
12% 0.32 59,000 8,900 — — 33,500 2,700 7,400 — 1,600
White Green 0.37 41,000 8,000 39 560 20,000 1,900 5,200 2,100 1,500
12% 0.39 68,000 10,300 50 510 40,000 3,700 7,600 2,100 2,100
Hemlock
Eastern Green 0.38 44,000 7,400 46 530 21,200 2,500 5,900 1,600 1,800
12% 0.40 61,000 8,300 47 530 37,300 4,500 7,300 — 2,200
Mountain Green 0.42 43,000 7,200 76 810 19,900 2,600 6,400 2,300 2,100
12% 0.45 79,000 9,200 72 810 44,400 5,900 10,600 — 3,000
Western Green 0.42 46,000 9,000 48 560 23,200 1,900 5,900 2,000 1,800
12% 0.45 78,000 11,300 57 580 49,000 3,800 8,600 2,300 2,400
Larch, western Green 0.48 53,000 10,100 71 740 25,900 2,800 6,000 2,300 2,300
12% 0.52 90,000 12,900 87 890 52,500 6,400 9,400 3,000 3,700
Pine
Eastern white Green 0.34 34,000 6,800 36 430 16,800 1,500 4,700 1,700 1,300
12% 0.35 59,000 8,500 47 460 33,100 3,000 6,200 2,100 1,700
Jack Green 0.40 41,000 7,400 50 660 20,300 2,100 5,200 2,500 1,800
12% 0.43 68,000 9,300 57 690 39,000 4,000 8,100 2,900 2,500
Loblolly Green 0.47 50,000 9,700 57 760 24,200 2,700 5,900 1,800 2,000
12% 0.51 88,000 12,300 72 760 49,200 5,400 9,600 3,200 3,100
Lodgepole Green 0.38 38,000 7,400 39 510 18,000 1,700 4,700 1,500 1,500
12% 0.41 65,000 9,200 47 510 37,000 4,200 6,100 2,000 2,100
Longleaf Green 0.54 59,000 11,000 61 890 29,800 3,300 7,200 2,300 2,600
12% 0.59 100,000 13,700 81 860 58,400 6,600 10,400 3,200 3,900
Pitch Green 0.47 47,000 8,300 63 — 20,300 2,500 5,900 — —
12% 0.52 74,000 9,900 63 — 41,000 5,600 9,400 — —

5–8
Table 5–3a. Strength properties of some commercially important woods grown in the United States (metric)
a
—con.
Static bending
Impact
bending
(mm)
Com-
pression
parallel
to grain
(kPa)
Com-
pression
perpen-
icular
to grain
(kPa)
Tension
perpen-
dicular
to grain
(kPa)
Side
hard-
ness
(N)
Modulus
of
rupture
(kPa)
Modulus
of
elasticity
c
(MPa)
Work to
maxi-
mum
load
(kJ m
–3
)
Shear
parallel
to
grain
(kPa)
Common species
names
Moisture
content
Specific
gravity
b
Pine—con.
Pond Green 0.51 51,000 8,800 52 — 25,200 3,000 6,500 — —
12% 0.56 80,000 12,100 59 — 52,000 6,300 9,500 — —
Ponderosa Green 0.38 35,000 6,900 36 530 16,900 1,900 4,800 2,100 1,400
12% 0.40 65,000 8,900 49 480 36,700 4,000 7,800 2,900 2,000
Red Green 0.41 40,000 8,800 42 660 18,800 1,800 4,800 2,100 1,500
12% 0.46 76,000 11,200 68 660 41,900 4,100 8,400 3,200 2,500
Sand Green 0.46 52,000 7,000 66 — 23,700 3,100 7,900 — —
12% 0.48 80,000 9,700 66 — 47,700 5,800 — — —
Shortleaf Green 0.47 51,000 9,600 57 760 24,300 2,400 6,300 2,200 2,000
12% 0.51 90,000 12,100 76 840 50,100 5,700 9,600 3,200 3,100
Slash Green 0.54 60,000 10,500 66 — 26,300 3,700 6,600 — —
12% 0.59 112,000 13,700 91 — 56,100 7,000 11,600 — —
Spruce Green 0.41 41,000 6,900 — — 19,600 1,900 6,200 — 2,000
12% 0.44 72,000 8,500 — — 39,000 5,000 10,300 — 2,900
Sugar Green 0.34 34,000 7,100 37 430 17,000 1,400 5,000 1,900 1,200
12% 0.36 57,000 8,200 38 460 30,800 3,400 7,800 2,400 1,700
Virginia Green 0.45 50,000 8,400 75 860 23,600 2,700 6,100 2,800 2,400
12% 0.48 90,000 10,500 94 810 46,300 6,300 9,300 2,600 3,300
Western white Green 0.36 32,000 8,200 34 480 16,800 1,300 4,700 1,800 1,200
12% 0.35 67,000 10,100 61 580 34,700 3,200 7,200 — 1,900
Redwood
Old-growth Green 0.38 52,000 8,100 51 530 29,000 2,900 5,500 1,800 1,800
12% 0.40 69,000 9,200 48 480 42,400 4,800 6,500 1,700 2,100
Young-growth Green 0.34 41,000 6,600 39 410 21,400 1,900 6,100 2,100 1,600
12% 0.35 54,000 7,600 36 380 36,000 3,600 7,600 1,700 1,900
Spruce
Black Green 0.38 42,000 9,500 51 610 19,600 1,700 5,100 700 1,500
12% 0.42 74,000 11,100 72 580 41,100 3,800 8,500 — 2,400
Engelmann Green 0.33 32,000 7,100 35 410 15,000 1,400 4,400 1,700 1,150
12% 0.35 64,000 8,900 44 460 30,900 2,800 8,300 2,400 1,750
Red Green 0.37 41,000 9,200 48 460 18,800 1,800 5,200 1,500 1,600
12% 0.40 74,000 11,400 58 640 38,200 3,800 8,900 2,400 2,200
Sitka Green 0.37 39,000 8,500 43 610 18,400 1,900 5,200 1,700 1,600
12% 0.40 70,000 10,800 65 640 38,700 4,000 7,900 2,600 2,300
White Green 0.33 34,000 7,900 41 560 16,200 1,400 4,400 1,500 1,200
12% 0.36 65,000 9,600 53 510 35,700 3,000 6,700 2,500 1,800
Tamarack Green 0.49 50,000 8,500 50 710 24,000 2,700 5,900 1,800 1,700
12% 0.53 80,000 11,300 49 580 49,400 5,500 8,800 2,800 2,600
a
Results of tests on clear specimens in the green and air-dried conditions, converted to metric units directly from Table 5–3b. Definition of properties:
impact bending is height of drop that causes complete failure, using 0.71-kg (50-lb) hammer; compression parallel to grain is also called maximum
crushing strength; compression perpendicular to grain is fiber stress at proportional limit; shear is maximum shearing strength; tension is maximum tensile
strength; and side hardness is hardness measured when load is perpendicular to grain.
b
Specific gravity is based on weight when ovendry and volume when green or at 12% moisture content.
c
Modulus of elasticity measured from a simply supported, center-loaded beam, on a span depth ratio of 14/1. To correct for shear deflection, the modulus
can be increased by 10%.
d
Values for side hardness of the true hickories are from Bendtsen and Ethington (1975).
e
Coast Douglas-fir is defined as Douglas-fir growing in Oregon and Washington State west of the Cascade Mountains summit. Interior West includes
California and all counties in Oregon and Washington east of, but adjacent to, the Cascade summit; Interior North, the remainder of Oregon and
Washington plus Idaho, Montana, and Wyoming; and Interior South, Utah, Colorado, Arizona, and New Mexico.
General Technical Report FPL–GTR–190

Chapter 5 Mechanical Properties of Wood
Errata, 2018: Corrected MOR value for 12% MC white ash. 5–9
Table 5–3b. Strength properties of some commercially important woods grown in the United States (inch–pound)
a
Static bending
Impact
bending
(in.)
Com-
pression
parallel
to grain
(lbf in
–2
)
Com-
pression
perpen-
dicular
to grain
(lbf in
–2
)
Side
hard-
ness
(lbf)
Modulus
of
rupture
(lbf in
–2
)
Modulus
of
elasticity
c
(10
6
lbf in
–2
)
Work
to
maxi-
mum
load
(in-lbf in
–3
)
Common species
names
Moisture
content
Specific
gravity
b
Shear
parallel
to
grain
(lbf in
–2
)
Tension
perpen-
dicular
to grain
(lbf in
–2
)
Hardwoods
Alder, red Green 0.37 6,500 1.17 8.0 22 2,960 250 770 390 440
12% 0.41 9,800 1.38 8.4 20 5,820 440 1,080 420 590
Ash
Black Green 0.45 6,000 1.04 12.1 33 2,300 350 860 490 520
12% 0.49 12,600 1.60 14.9 35 5,970 760 1,570 700 850
Blue Green 0.53 9,600 1.24 14.7 — 4,180 810 1,540 — —
12% 0.58 13,800 1.40 14.4 — 6,980 1,420 2,030 — —
Green Green 0.53 9,500 1.40 11.8 35 4,200 730 1,260 590 870
12% 0.56 14,100 1.66 13.4 32 7,080 1,310 1,910 700 1,200
Oregon Green 0.50 7,600 1.13 12.2 39 3,510 530 1,190 590 790
12% 0.55 12,700 1.36 14.4 33 6,040 1,250 1,790 720 1,160
White Green 0.55 9,500 1.44 15.7 38 3,990 670 1,350 590 960
12% 0.60
15,
400 1.74 16.6 43 7,410 1,160 1,910 940 1,320
Aspen
Bigtooth Green 0.36 5,400 1.12 5.7 — 2,500 210 730 — —
12% 0.39 9,100 1.43 7.7 — 5,300 450 1,080 — —
Quaking Green 0.35 5,100 0.86 6.4 22 2,140 180 660 230 300
12% 0.38 8,400 1.18 7.6 21 4,250 370 850 260 350
Basswood, American Green 0.32 5,000 1.04 5.3 16 2,220 170 600 280 250
12% 0.37 8,700 1.46 7.2 16 4,730 370 990 350 410
Beech, American Green 0.56 8,600 1.38 11.9 43 3,550 540 1,290 720 850
12% 0.64 14,900 1.72 15.1 41 7,300 1,010 2,010 1,010 1,300
Birch
Paper Green 0.48 6,400 1.17 16.2 49 2,360 270 840 380 560
12% 0.55 12,300 1.59 16.0 34 5,690 600 1,210 — 910
Sweet Green 0.60 9,400 1.65 15.7 48 3,740 470 1,240 430 970
12% 0.65 16,900 2.17 18.0 47 8,540 1,080 2,240 950 1,470
Yellow Green 0.55 8,300 1.50 16.1 48 3,380 430 1,110 430 780
12% 0.62 16,600 2.01 20.8 55 8,170 970 1,880 920 1,260
Butternut Green 0.36 5,400 0.97 8.2 24 2,420 220 760 430 390
12% 0.38 8,100 1.18 8.2 24 5,110 460 1,170 440 490
Cherry, black Green 0.47 8,000 1.31 12.8 33 3,540 360 1,130 570 660
12% 0.50 12,300 1.49 11.4 29 7,110 690 1,700 560 950
Chestnut, American Green 0.40 5,600 0.93 7.0 24 2,470 310 800 440 420
12% 0.43 8,600 1.23 6.5 19 5,320 620 1,080 460 540
Cottonwood
Balsam, poplar Green 0.31 3,900 0.75 4.2 — 1,690 140 500 — —
12% 0.34 6,800 1.10 5.0 — 4,020 300 790 — —
Black Green 0.31 4,900 1.08 5.0 20 2,200 160 610 270 250
12% 0.35 8,500 1.27 6.7 22 4,500 300 1,040 330 350
Eastern Green 0.37 5,300 1.01 7.3 21 2,280 200 680 410 340
12% 0.40 8,500 1.37 7.4 20 4,910 380 930 580 430
Elm
American Green 0.46 7,200 1.11 11.8 38 2,910 360 1,000 590 620
12% 0.50 11,800 1.34 13.0 39 5,520 690 1,510 660 830
Rock Green 0.57 9,500 1.19 19.8 54 3,780 610 1,270 — 940
12% 0.63 14,800 1.54 19.2 56 7,050 1,230 1,920 — 1,320
Slippery Green 0.48 8,000 1.23 15.4 47 3,320 420 1,110 640 660
12% 0.53 13,000 1.49 16.9 45 6,360 820 1,630 530 860
Hackberry Green 0.49 6,500 0.95 14.5 48 2,650 400 1,070 630 700
12% 0.53 11,000 1.19 12.8 43 5,440 890 1,590 580 880

5–10
Table 5–3b. Strength properties of some commercially important woods grown in the United States (inch–pound)
a
—con.
Static bending
Impact
bending
(in.)
Com-
pression
parallel
to grain
(lbf in
–2
)
Com-
pression
perpen-
dicular
to grain
(lbf in
–2
)
Shear
parallel
to
grain
(lbf in
–2
)
Tension
perpen-
dicular
to grain
(lbf in
–2
)
Side
hard-
ness
(lbf)
Modulus
of
rupture
(lbf in
–2
)
Modulus
of
elasticity
c
(10
6
lbf in
–2
)
Work
to
maxi-
mum
load
(in-lbf in
–3
)
Common species
names
Moisture
content
Specific
gravity
b
Hickory, pecan
Bitternut Green 0.60 10,300 1.40 20.0 66 4,570 800 1,240 — —
12% 0.66 17,100 1.79 18.2 66 9,040 1,680 — — —
Nutmeg Green 0.56 9,100 1.29 22.8 54 3,980 760 1,030 — —
12% 0.60 16,600 1.70 25.1 — 6,910 1,570 — — —
Pecan Green 0.60 9,800 1.37 14.6 53 3,990 780 1,480 680 1,31
0
12% 0.66 13,700 1.73 13.8 44 7,850 1,720 2,080 — 1,82
0
Water Green 0.61 10,700 1.56 18.8 56 4,660 880 1,440 — —
12% 0.62 17,800 2.02 19.3 53 8,600 1,550 — — —
Hickory, true
d
Mockernut Green 0.64 11,100 1.57 26.1 88 4,480 810 1,280 — 1,440
12% 0.72 19,200 2.22 22.6 77 8,940 1,730 1,740 — 1,970
Pignut Green 0.66 11,700 1.65 31.7 89 4,810 920 1,370 — 1,520
12% 0.75 20,100 2.26 30.4 74 9,190 1,980 2,150 — 2,140
Shagbark Green 0.64 11,000 1.57 23.7 74 4,580 840 1,520 — 1,460
12% 0.72 20,200 2.16 25.8 67 9,210 1,760 2,430 — 1,880
Shellbark Green 0.62 10,500 1.34 29.9 104 3,920 810 1,190 — 1,670
12% 0.69 18,100 1.89 23.6 88 8,000 1,800 2,110 — 1,810
Honeylocust Green 0.60 10,200 1.29 12.6 47 4,420 1,150 1,660 930 1,39
0
12% — 14,700 1.63 13.3 47 7,500 1,840 2,250 900 1,58
0
Locust, black Green 0.66 13,800 1.85 15.4 44 6,800 1,160 1,760 770 1,57
0
12% 0.69 19,400 2.05 18.4 57 10,180 1,830 2,480 640 1,70
0
Magnolia
Cucumbertree Green 0.44 7,400 1.56 10.0 30 3,140 330 990 440 52
0
12% 0.48 12,300 1.82 12.2 35 6,310 570 1,340 660 70
0
Southern Green 0.46 6,800 1.11 15.4 54 2,700 460 1,040 610 74
0
12% 0.50 11,200 1.40 12.8 29 5,460 860 1,530 740 1,02
0
Maple
Bigleaf Green 0.44 7,400 1.10 8.7 23 3,240 450 1,110 600 62
0
12% 0.48 10,700 1.45 7.8 28 5,950 750 1,730 540 85
0
Black Green 0.52 7,900 1.33 12.8 48 3,270 600 1,130 720 84
0
12% 0.57 13,300 1.62 12.5 40 6,680 1,020 1,820 670 1,18
0
Red Green 0.49 7,700 1.39 11.4 32 3,280 400 1,150 — 70
0
12% 0.54 13,400 1.64 12.5 32 6,540 1,000 1,850 — 95
0
Silver Green 0.44 5,800 0.94 11.0 29 2,490 370 1,050 560 59
0
12% 0.47 8,900 1.14 8.3 25 5,220 740 1,480 500 70
0
Sugar Green 0.56 9,400 1.55 13.3 40 4,020 640 1,460 — 97
0
12% 0.63 15,800 1.83 16.5 39 7,830 1,470 2,330 — 1,45
0
Oak, red
Black Green 0.56 8,200 1.18 12.2 40 3,470 710 1,220 — 1,06
0
12% 0.61 13,900 1.64 13.7 41 6,520 930 1,910 — 1,21
0
Cherrybark Green 0.61 10,800 1.79 14.7 54 4,620 760 1,320 800 1,24
0
12% 0.68 18,100 2.28 18.3 49 8,740 1,250 2,000 840 1,48
0
Laurel Green 0.56 7,900 1.39 11.2 39 3,170 570 1,180 770 1,00
0
12% 0.63 12,600 1.69 11.8 39 6,980 1,060 1,830 790 1,21
0
Northern red Green 0.56 8,300 1.35 13.2 44 3,440 610 1,210 750 1,00
0
12% 0.63 14,300 1.82 14.5 43 6,760 1,010 1,780 800 1,29
0
Pin Green 0.58 8,300 1.32 14.0 48 3,680 720 1,290 800 1,07
0
12% 0.63 14,000 1.73 14.8 45 6,820 1,020 2,080 1,050 1,51
0
Scarlet Green 0.60 10,400 1.48 15.0 54 4,090 830 1,410 700 1,20
0
12% 0.67 17,400 1.91 20.5 53 8,330 1,120 1,890 870 1,40
0
Southern red Green 0.52 6,900 1.14 8.0 29 3,030 550 930 480 86
0
12% 0.59 10,900 1.49 9.4 26 6,090 870 1,390 510 1,06
0
General Technical Report FPL–GTR–190

Chapter 5 Mechanical Properties of Wood
5–11
Table 5–3b. Strength properties of some commercially important woods grown in the United States (inch–pound)
a
—con.
Static bending
Impact
bending
(in.)
Com-
pression
parallel
to grain
(lbf in
–2
)
Com-
pression
perpen-
dicular
to grain
(lbf in
–2
)
Shear
parallel
to
grain
(lbf in
–2
)
Tension
perpen-
dicular
to grain
(lbf in
–2
)
Side
hard-
ness
(lbf)
Modulus
of
rupture
(lbf in
–2
)
Modulus
of
elasticity
c
(10
6
lbf in
–2
)
Work
to
maxi-
mum
load
(in-lbf in
–3
)
Common species
names
Moisture
content
Specific
gravity
b
Oak, red—con.
Water Green 0.56 8,900 1.55 11.1 39 3,740 620 1,240 820 1,010
12% 0.63 15,400 2.02 21.5 44 6,770 1,020 2,020 920 1,190
Willow Green 0.56 7,400 1.29 8.8 35 3,000 610 1,180 760 980
12% 0.69 14,500 1.90 14.6 42 7,040 1,130 1,650 — 1,460
Oak, white
Bur Green 0.58 7,200 0.88 10.7 44 3,290 680 1,350 800 1,110
12% 0.64 10,300 1.03 9.8 29 6,060 1,200 1,820 680 1,370
Chestnut Green 0.57 8,000 1.37 9.4 35 3,520 530 1,210 690 890
12% 0.66 13,300 1.59 11.0 40 6,830 840 1,490 — 1,130
Live Green 0.80 11,900 1.58 12.3 — 5,430 2,040 2,210 — —
12% 0.88 18,400 1.98 18.9 — 8,900 2,840 2,660 — —
Overcup Green 0.57 8,000 1.15 12.6 44 3,370 540 1,320 730 960
12% 0.63 12,600 1.42 15.7 38 6,200 810 2,000 940 1,190
Post Green 0.60 8,100 1.09 11.0 44 3,480 860 1,280 790 1,130
12% 0.67 13,200 1.51 13.2 46 6,600 1,430 1,840 780 1,360
Swamp chestnut Green 0.60 8,500 1.35 12.8 45 3,540 570 1,260 670 1,110
12% 0.67 13,900 1.77 12.0 41 7,270 1,110 1,990 690 1,240
Swamp white Green 0.64 9,900 1.59 14.5 50 4,360 760 1,300 860 1,160
12% 0.72 17,700 2.05 19.2 49 8,600 1,190 2,000 830 1,620
White Green 0.60 8,300 1.25 11.6 42 3,560 670 1,250 770 1,060
12% 0.68 15,200 1.78 14.8 37 7,440 1,070 2,000 800 1,360
Sassafras Green 0.42 6,000 0.91 7.1 — 2,730 370 950 — —
12% 0.46 9,000 1.12 8.7 — 4,760 850 1,240 — —
Sweetgum Green 0.46 7,100 1.20 10.1 36 3,040 370 990 540 600
12% 0.52 12,500 1.64 11.9 32 6,320 620 1,600 760 850
Sycamore, American Green 0.46 6,500 1.06 7.5 26 2,920 360 1,000 630 610
12% 0.49 10,000 1.42 8.5 26 5,380 700 1,470 720 770
Tanoak Green 0.58 10,500 1.55 13.4 — 4,650 — — — —
12% — — — — — — — — — —
Tupelo
Black Green 0.46 7,000 1.03 8.0 30 3,040 480 1,100 570 640
12% 0.50 9,600 1.20 6.2 22 5,520 930 1,340 500 810
Water Green 0.46 7,300 1.05 8.3 30 3,370 480 1,190 600 710
12% 0.50 9,600 1.26 6.9 23 5,920 870 1,590 700 880
Walnut, Black Green 0.51 9,500 1.42 14.6 37 4,300 490 1,220 570 900
12% 0.55 14,600 1.68 10.7 34 7,580 1,010 1,370 690 1,010
Willow, Black Green 0.36 4,800 0.79 11.0 — 2,040 180 680 — —
12% 0.39 7,800 1.01 8.8 — 4,100 430 1,250 — —
Yellow-poplar Green 0.40 6,000 1.22 7.5 26 2,660 270 790 510 440
12% 0.42 10,100 1.58 8.8 24 5,540 500 1,190 540 540
Softwoods
Baldcypress Green 0.42 6,600 1.18 6.6 25 3,580 400 810 300 390
12% 0.46 10,600 1.44 8.2 24 6,360 730 1,000 270 510
Cedar
Atlantic white Green 0.31 4,700 0.75 5.9 18 2,390 240 690 180 290
12% 0.32 6,800 0.93 4.1 13 4,700 410 800 220 350
Eastern redcedar Green 0.44 7,000 0.65 15.0 35 3,570 700 1,010 330 650
12% 0.47 8,800 0.88 8.3 22 6,020 920 — — —
Incense Green 0.35 6,200 0.84 6.4 17 3,150 370 830 280 390
12% 0.37 8,000 1.04 5.4 17 5,200 590 880 270 470
Northern White Green 0.29 4,200 0.64 5.7 15 1,990 230 620 240 230
12% 0.31 6,500 0.80 4.8 12 3,960 310 850 240 320

5–12
Table 5–3b. Strength properties of some commercially important woods grown in the United States (inch–pound)
a
—con.
Static bending
Impact
bending
(in.)
Com-
pression
parallel
to grain
(lbf in
–2
)
Com-
pression
perpen-
dicular
to grain
(lbf in
–2
)
Shear
parallel
to
grain
(lbf in
–2
)
Tension
perpen-
dicular
to grain
(lbf in
–2
)
Side
hard-
ness
(lbf)
Modulus
of
rupture
(lbf in
–2
)
Modulus
of
elasticity
c
(10
6
lbf in
–2
)
Work
to
maxi-
mum
load
(in-lbf in
–3
)
Common species
names
Moisture
content
Specific
gravity
b
Cedar—con.
Port-Orford Green 0.39 6,600 1.30 7.4 21 3,140 300 840 180 380
12% 0.43 12,700 1.70 9.1 28 6,250 720 1,370 400 630
Western redcedar Green 0.31 5,200 0.94 5.0 17 2,770 240 770 230 260
12% 0.32 7,500 1.11 5.8 17 4,560 460 990 220 350
Yellow Green 0.42 6,400 1.14 9.2 27 3,050 350 840 330 440
12% 0.44 11,100 1.42 10.4 29 6,310 620 1,130 360 580
Douglas-fir
e
Coast Green 0.45 7,700 1.56 7.6 26 3,780 380 900 300 500
12% 0.48 12,400 1.95 9.9 31 7,230 800 1,130 340 710
Interior West Green 0.46 7,700 1.51 7.2 26 3,870 420 940 290 510
12% 0.50 12,600 1.83 10.6 32 7,430 760 1,290 350 660
Interior North Green 0.45 7,400 1.41 8.1 22 3,470 360 950 340 420
12% 0.48 13,100 1.79 10.5 26 6,900 770 1,400 390 600
Interior South Green 0.43 6,800 1.16 8.0 15 3,110 340 950 250 360
12% 0.46 11,900 1.49 9.0 20 6,230 740 1,510 330 510
Fir
Balsam Green 0.33 5,500 1.25 4.7 16 2,630 190 660 180 290
12% 0.35 9,200 1.45 5.1 20 5,280 400 940 180 380
California red Green 0.36 5,800 1.17 6.4 21 2,760 330 770 380 360
12% 0.38 10,500 1.50 8.9 24 5,460 610 1,040 390 500
Grand Green 0.35 5,800 1.25 5.6 22 2,940 270 740 240 360
12% 0.37 8,900 1.57 7.5 28 5,290 500 900 240 490
Noble Green 0.37 6,200 1.38 6.0 19 3,010 270 800 230 290
12% 0.39 10,700 1.72 8.8 23 6,100 520 1,050 220 410
Pacific silver Green 0.40 6,400 1.42 6.0 21 3,140 220 750 240 310
12% 0.43 11,000 1.76 9.3 24 6,410 450 1,220 — 430
Subalpine Green 0.31 4,900 1.05 — — 2,300 190 700 — 260
12% 0.32 8,600 1.29 — — 4,860 390 1,070 — 350
White Green 0.37 5,900 1.16 5.6 22 2,900 280 760 300 340
12% 0.39 9,800 1.50 7.2 20 5,800 530 1,100 300 480
Hemlock
Eastern Green 0.38 6,400 1.07 6.7 21 3,080 360 850 230 400
12% 0.40 8,900 1.20 6.8 21 5,410 650 1,060 — 500
Mountain Green 0.42 6,300 1.04 11.0 32 2,880 370 930 330 470
12% 0.45 11,500 1.33 10.4 32 6,440 860 1,540 — 680
Western Green 0.42 6,600 1.31 6.9 22 3,360 280 860 290 410
12% 0.45 11,300 1.63 8.3 23 7,200 550 1,290 340 540
Larch, western Green 0.48 7,700 1.46 10.3 29 3,760 400 870 330 510
12% 0.52 13,000 1.87 12.6 35 7,620 930 1,360 430 830
Pine
Eastern white Green 0.34 4,900 0.99 5.2 17 2,440 220 680 250 290
12% 0.35 8,600 1.24 6.8 18 4,800 440 900 310 380
Jack Green 0.40 6,000 1.07 7.2 26 2,950 300 750 360 400
12% 0.43 9,900 1.35 8.3 27 5,660 580 1,170 420 570
Loblolly Green 0.47 7,300 1.40 8.2 30 3,510 390 860 260 450
12% 0.51 12,800 1.79 10.4 30 7,130 790 1,390 470 690
Lodgepole Green 0.38 5,500 1.08 5.6 20 2,610 250 680 220 330
12% 0.41 9,400 1.34 6.8 20 5,370 610 880 290 480
Longleaf Green 0.54 8,500 1.59 8.9 35 4,320 480 1,040 330 590
12% 0.59 14,500 1.98 11.8 34 8,470 960 1,510 470 870
Pitch Green 0.47 6,800 1.20 9.2 — 2,950 360 860 — —
12% 0.52 10,800 1.43 9.2 — 5,940 820 1,360 — —
General Technical Report FPL–GTR–190

Chapter 5 Mechanical Properties of Wood
5–13
Table 5–3b. Strength properties of some commercially important woods grown in the United States (inch–pound)
a
—con.
Static bending
Impact
bending
(in.)
Com-
pression
parallel
to grain
(lbf in
–2
)
Com-
pression
perpen-
dicular
to grain
(lbf in
–2
)
Shear
parallel
to
grain
(lbf in
–2
)
Tension
perpen-
dicular
to grain
(lbf in
–2
)
Side
hard-
ness
(lbf)
Modulus
of
rupture
(lbf in
–2
)
Modulus
of
elasticity
c
(10
6
lbf in
–2
)
Work
to
maxi-
mum
load
(in-lbf in
–3
)
Common species
names
Moisture
content
Specific
gravity
b
Pine—con.
Pond Green 0.51 7,400 1.28 7.5 — 3,660 440 940 — —
12% 0.56 11,600 1.75 8.6 — 7,540 910 1,380 — —
Ponderosa Green 0.38 5,100 1.00 5.2 21 2,450 280 700 310 320
12% 0.40 9,400 1.29 7.1 19 5,320 580 1,130 420 460
Red Green 0.41 5,800 1.28 6.1 26 2,730 260 690 300 340
12% 0.46 11,000 1.63 9.9 26 6,070 600 1,210 460 560
Sand Green 0.46 7,500 1.02 9.6 — 3,440 450 1,140 — —
12% 0.48 11,600 1.41 9.6 — 6,920 836 — — —
Shortleaf Green 0.47 7,400 1.39 8.2 30 3,530 350 910 320 440
12% 0.51 13,100 1.75 11.0 33 7,270 820 1,390 470 690
Slash Green 0.54 8,700 1.53 9.6 — 3,820 530 960 — —
12% 0.59 16,300 1.98 13.2 — 8,140 1,020 1,680 — —
Spruce Green 0.41 6,000 1.00 — — 2,840 280 900 — 450
12% 0.44 10,400 1.23 — — 5,650 730 1,490 — 660
Sugar Green 0.34 4,900 1.03 5.4 17 2,460 210 720 270 270
12% 0.36 8,200 1.19 5.5 18 4,460 500 1,130 350 380
Virginia Green 0.45 7,300 1.22 10.9 34 3,420 390 890 400 540
12% 0.48 13,000 1.52 13.7 32 6,710 910 1,350 380 740
Western white Green 0.35 4,700 1.19 5.0 19 2,430 190 680 260 260
12% 0.38 9,700 1.46 8.8 23 5,040 470 1,040 — 420
Redwood
Old-growth Green 0.38 7,500 1.18 7.4 21 4,200 420 800 260 410
12% 0.40 10,000 1.34 6.9 19 6,150 700 940 240 480
Young-growth Green 0.34 5,900 0.96 5.7 16 3,110 270 890 300 350
12% 0.35 7,900 1.10 5.2 15 5,220 520 1,110 250 420
Spruce
Black Green 0.38 6,100 1.38 7.4 24 2,840 240 740 100 340
12% 0.42 10,800 1.61 10.5 23 5,960 550 1,230 — 530
Engelmann Green 0.33 4,700 1.03 5.1 16 2,180 200 640 240 260
12% 0.35 9,300 1.30 6.4 18 4,480 410 1,200 350 390
Red Green 0.37 6,000 1.33 6.9 18 2,720 260 750 220 340
12% 0.40 10,800 1.66 8.4 25 5,540 550 1,290 350 530
Sitka Green 0.37 5,700 1.23 6.3 24 2,670 280 760 250 350
12% 0.40 10,200 1.57 9.4 25 5,610 580 1,150 370 510
White Green 0.33 5,000 1.14 6.0 22 2,350 210 640 220 270
12% 0.36 9,400 1.43 7.7 20 5,180 430 970 360 410
Tamarack Green 0.49 7,200 1.24 7.2 28 3,480 390 860 260 380
12% 0.53 11,600 1.64 7.1 23 7,160 800 1,280 400 590
a
Results of tests on clear specimens in the green and air-dried conditions. Definition of properties: impact bending is height of drop that causes complete failure,
using 0.71-kg (50-lb) hammer; compression parallel to grain is also called maximum crushing strength; compression perpendicular to grain is fiber stress at
p
roportional limit; shear is maximum shearing strength; tension is maximum tensile strength; and side hardness is hardness measured when load is perpendicular
to grain.
b
Specific gravity is based on weight when ovendry and volume when green or at 12% moisture content.
c
Modulus of elasticity measured from a simply supported, center-loaded beam, on a span depth ratio of 14/1. To correct for shear deflection, the modulus can be
increased by 10%.
d
Values for side hardness of the true hickories are from Bendtsen and Ethington (1975).
e
Coast Douglas-fir is defined as Douglas-fir growing in Oregon and Washington State west of the Cascade Mountains summit. Interior West includes California
and all counties in Oregon and Washington east of, but adjacent to, the Cascade summit; Interior North, the remainder of Oregon and Washington plus Idaho,
Montana, and Wyoming; and Interior South, Utah, Colorado, Arizona, and New Mexico.

5–14
Table 5–4a. Mechanical properties of some commercially important woods grown in Canada and imported
into the United States (metric)
a
Static bending
Compression
parallel
to grain
(kPa)
Compression
perpendicular
to grain
(kPa)
Shear
parallel
to grain
(kPa)
Common species
names
Moisture
content
Specific
gravity
Modulus of
rupture
(kPa)
Modulus of
elasticity
(MPa)
Hardwoods
Aspen
Quaking Green 0.37 38,000 9,000 16,200 1,400 5,000
12% 68,000 11,200 36,300 3,500 6,800
Big-toothed Green 0.39 36,000 7,400 16,500 1,400 5,400
12% 66,000 8,700 32,800 3,200 7,600
Cottonwood
Balsam, poplar Green 0.37 34,000 7,900 14,600 1,200 4,600
12% 70,000 11,500 34,600 2,900 6,100
Black Green 0.30 28,000 6,700 12,800 700 3,900
12% 49,000 8,800 27,700 1,800 5,900
Eastern Green 0.35 32,000 6,000 13,600 1,400 5,300
12% 52,000 7,800 26,500 3,200 8,000
Softwoods
Cedar
Northern white Green 0.30 27,000 3,600 13,000 1,400 4,600
12% 42,000 4,300 24,800 2,700 6,900
Western redcedar Green 0.31 36,000 7,200 19,200 1,900 4,800
12% 54,000 8,200 29,600 3,400 5,600
Yellow Green 0.42 46,000 9,200 22,300 2,400 6,100
12% 80,000 11,000 45,800 4,800 9,200
Douglas-fir Green 0.45 52,000 11,100 24,900 3,200 6,300
12% 88,000 13,600 50,000 6,000 9,500
Fir
Subalpine Green 0.33 36,000 8,700 17,200 1,800 4,700
12% 56,000 10,200 36,400 3,700 6,800
Pacific silver Green 0.36 38,000 9,300 19,100 1,600 4,900
12% 69,000 11,300 40,900 3,600 7,500
Balsam Green 0.34 36,000 7,800 16,800 1,600 4,700
12% 59,000 9,600 34,300 3,200 6,300
Hemlock
Eastern Green 0.40 47,000 8,800 23,600 2,800 6,300
12% 67,000 9,700 41,200 4,300 8,700
Western Green 0.41 48,000 10,200 24,700 2,600 5,200
12% 81,000 12,300 46,700 4,600 6,500
Larch, western Green 0.55 60,000 11,400 30,500 3,600 6,300
12% 107,000 14,300 61,000 7,300 9,200
Pine
Eastern white Green 0.36 35,000 8,100 17,900 1,600 4,400
12% 66,000 9,400 36,000 3,400 6,100
Jack Green 0.42 43,000 8,100 20,300 2,300 5,600
12% 78,000 10,200 40,500 5,700 8,200
Lodgepole Green 0.40 39,000 8,800 19,700 1,900 5,000
12% 76,000 10,900 43,200 3,600 8,500
Ponderosa Green 0.44 39,000 7,800 19,600 2,400 5,000
12% 73,000 9,500 42,300 5,200 7,000
Red Green 0.39 34,000 7,400 16,300 1,900 4,900
12% 70,000 9,500 37,900 5,200 7,500
Western white Green 0.36 33,000 8,200 17,400 1,600 4,500
12% 64,100 10,100 36,100 3,200 6,300
Spruce
Black Green 0.41 41,000 9,100 19,000 2,100 5,500
12% 79,000 10,500 41,600 4,300 8,600
General Technical Report FPL–GTR–190

of clear wood parallel to grain. Table 5–7 lists average ten-
sile strength values for a limited number of specimens of a
few species. In the absence of sufcient tension test data,
modulus of rupture values are sometimes substituted for
tensile strength of small, clear, straight-grained pieces of
wood. The modulus of rupture is considered to be a low or
conservative estimate of tensile strength for clear specimens
(this is not true for lumber).
Less Common Properties
Strength properties less commonly measured in clear wood
include torsion, toughness, rolling shear, and fracture
toughness. Other properties involving time under load
include creep, creep rupture or duration of load, and fatigue
strength.
Torsion strength—Resistance to twisting about a longitu-
dinal axis. For solid wood members, torsional shear strength
may be taken as shear strength parallel to grain. Two-thirds
of the value for torsional shear strength may be used as an
estimate of the torsional shear stress at the proportional
limit.
Toughness—Energy required to cause rapid complete fail-
ure in a centrally loaded bending specimen. Tables 5–8 and
5–9 give average toughness values for samples of a few
hardwood and softwood species. Average coefcients of
variation for toughness as determined from approximately
50 species are shown in Table 5–6.
Creep and duration of load—Time-dependent deformation
of wood under load. If the load is sufciently high and the
duration of load is long, failure (creep–rupture) will eventu-
ally occur. The time required to reach rupture is commonly
called duration of load. Duration of load is an important fac-
tor in setting design values for wood. Creep and duration of
load are described in later sections of this chapter.
Fatigue—Resistance to failure under specic combina-
tions of cyclic loading conditions: frequency and number
of cycles, maximum stress, ratio of maximum to minimum
stress, and other less-important factors. The main factors
affecting fatigue in wood are discussed later in this chapter.
The discussion also includes interpretation of fatigue data
and information on fatigue as a function of the service
environment.
Rolling shear strength—Shear strength of wood where
shearing force is in a longitudinal plane and is acting per-
pendicular to the grain. Few test values of rolling shear in
solid wood have been reported. In limited tests, rolling shear
strength averaged 18% to 28% of parallel-to-grain shear
values. Rolling shear strength is about the same in the longi-
tudinal–radial and longitudinal–tangential planes.
Nanoindentation hardness—This type of hardness mea-
surement is conducted at the nanometer scale (the scale of
the cell wall). Nanoindentation uses an extremely small
indenter of a hard material and specied shape (usually a
pyramid) to press into the surface with sufcient force that
the wood deforms. The load and deformation history is used
to develop mechanical property information. Nanoinden-
tion hardness provides a method for describing a material’s
response to various applied loading conditions at a scale that
may explain differences in wood cell structures and help
predict material performance after chemical treatments have
been applied (Moon and others 2006).
Fracture toughness—Ability of wood to withstand aws
that initiate failure. Measurement of fracture toughness
helps identify the length of critical aws that initiate failure
in materials.
To date, there is no standard test method for determining
fracture toughness in wood. Three types of stress elds, and
Chapter 5 Mechanical Properties of Wood
5–15
Table 5
–
4a. Mechanical properties of some commercially important woods grown in Canada and imported
into the United States (metric)
a
—con.
Common species
names
Moisture
content
Specific
gravity
Static bending
Compression
parallel
to grain
(kPa)
Compression
perpendicular
to grain
(kPa)
Shear
parallel
to grain
(kPa)
Modulus of
rupture
(kPa)
Modulus of
elasticity
(MPa)
Engelmann Green 0.38 39,000 8,600 19,400 1,900 4,800
12% 70,000 10,700 42,400 3,700 7,600
Red Green 0.38 41,000 9,100 19,400 1,900 5,600
12% 71,000 11,000 38,500 3,800 9,200
Sitka Green 0.35 37,000 9,400 17,600 2,000 4,300
12% 70,000 11,200 37,800 4,100 6,800
White Green 0.35 35,000 7,900 17,000 1,600 4,600
12% 63,000 10,000 37,000 3,400 6,800
Tamarack Green 0.48 47,000 8,600 21,600 2,800 6,300
12% 76,000 9,400 44,900 6,200 9,000
a
Results of tests on clear, straight-grained specimens. Property values based on ASTM Standard D 2555–88. Information on additional
p
roperties can be obtained from Department of Forestry, Canada, Publication No. 1104. For each species, values in the first line are from tests
of green material; those in the second line are adjusted from the green condition to 12% moisture content using dry to green clear wood
p
roperty ratios as
r
eported in ASTM D 2555–88. Specific gravity is based on weight when ovendry and volume when green.

5–16
Table 5–4b. Mechanical properties of some commercially important woods grown in Canada and imported
into the United States (inch–pound)
a
Static bending
Compression
parallel to
grain
(lbf in
–2
)
Compression
perpendicular
to grain
(lbf in
–2
)
Shear
parallel to
grain
(lbf in
–2
)
Common species
names
Moisture
content
Specific
gravity
Modulus of
rupture
(lbf in
–2
)
Modulus of
elasticity
(10
6
lbf in
–2
)
Hardwoods
Aspen
Quaking Green 0.37 5,500 1.31 2,350 200 720
12% 9,800 1.63 5,260 510 980
Bigtooth Green 0.39 5,300 1.08 2,390 210 790
12% 9,500 1.26 4,760 470 1,100
Cottonwood
Balsam, poplar Green 0.37 5,000 1.15 2,110 180 670
12% 10,100 1.67 5,020 420 890
Black Green 0.30 4,100 0.97 1,860 100 560
12% 7,100 1.28 4,020 260 860
Eastern Green 0.35 4,700 0.87 1,970 210 770
12% 7,500 1.13 3,840 470 1,160
Softwoods
Cedar
Northern white Green 0.30 3,900 0.52 1,890 200 660
12% 6,100 0.63 3,590 390 1,000
Western redcedar Green 0.31 5,300 1.05 2,780 280 700
12% 7,800 1.19 4,290 500 810
Yellow Green 0.42 6,600 1.34 3,240 350 880
12% 11,600 1.59 6,640 690 1,340
Douglas-fir Green 0.45 7,500 1.61 3,610 460 920
12% 12,800 1.97 7,260 870 1,380
Fir
Balsam Green 0.34 5,300 1.13 2,440 240 680
12% 8,500 1.40 4,980 460 910
Pacific silver Green 0.36 5,500 1.35 2,770 230 710
12% 10,000 1.64 5,930 520 1,190
Subalpine Green 0.33 5,200 1.26 2,500 260 680
12% 8,200 1.48 5,280 540 980
Hemlock
Eastern Green 0.40 6,800 1.27 3,430 400 910
12% 9,700 1.41 5,970 630 1,260
Western Green 0.41 7,000 1.48 3,580 370 750
12% 11,800 1.79 6,770 660 940
Larch, western Green 0.55 8,700 1.65 4,420 520 920
12% 15,500 2.08 8,840 1,060 1,340
Pine
Eastern white Green 0.36 5,100 1.18 2,590 240 640
12% 9,500 1.36 5,230 490 880
Jack Green 0.42 6,300 1.17 2,950 340 820
12% 11,300 1.48 5,870 830 1,190
Lodgepole Green 0.40 5,600 1.27 2,860 280 720
12% 11,000 1.58 6,260 530 1,240
Ponderosa Green 0.44 5,700 1.13 2,840 350 720
12% 10,600 1.38 6,130 760 1,020
Red Green 0.39 5,000 1.07 2,370 280 710
12% 10,100 1.38 5,500 720 1,090
Western white Green 0.36 4,800 1.19 2,520 240 650
12% 9,300 1.46 5,240 470 920
Spruce
Black Green 0.41 5,900 1.32 2,760 300 800
12% 11,400 1.52 6,040 620 1,250
Engelmann Green 0.38 5,700 1.25 2,810 270 700
12% 10,100 1.55 6,150 540 1,100
Red Green 0.38 5,900 1.32 2,810 270 810
12% 10,300 1.60 5,590 550 1,330
General Technical Report FPL–GTR–190
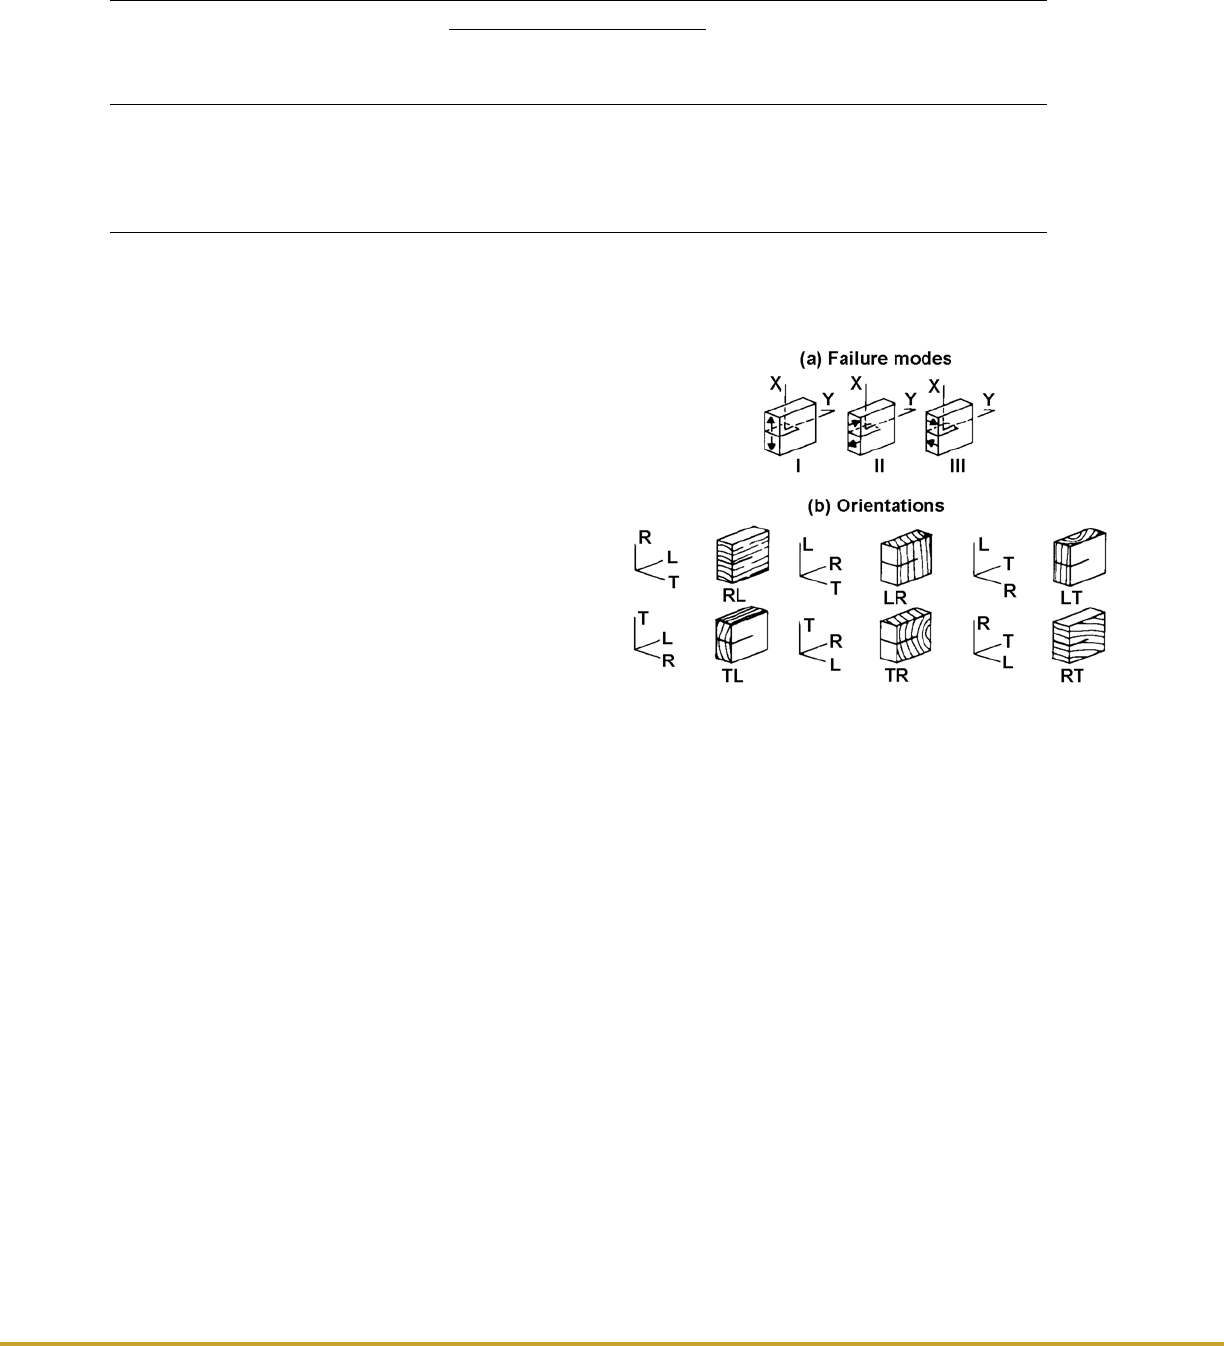
associated stress intensity factors, can be dened at a crack
tip: opening mode (I), forward shear mode (II), and trans-
verse shear mode (III) (Fig. 5–2a). A crack may lie in one of
these three planes and may propagate in one of two direc-
tions in each plane. This gives rise to six crack-propagation
systems (RL, TL, LR, TR, LT, and RT) (Fig. 5–2b). Of these
crack-propagation systems, four systems are of practical
importance: RL, TL, TR, and RT. Each of these four systems
allow for propagation of a crack along the lower strength
path parallel to the grain. The RL and TL orientations in
wood (where R or T is perpendicular to the crack plane
and L is the direction in which the crack propagates) will
predominate as a result of the low strength and stiffness of
wood perpendicular to the grain. It is therefore one of these
two orientations that is most often tested. Values for mode I
fracture toughness range from 220 to 550 kPa m
1/2
(200 to
500 lbf in
–2
in
1/2
) and for mode II range from 1,650 to
2,400 kPa m
1/2
(1,500 to 2,200 lbf in
–2
in
1/2
). Table 5–10
summarizes selected mode I and mode II test results at 10%
to 12% moisture content available in the literature. The
limited information available on moisture content effects on
fracture toughness suggests that fracture toughness is either
insensitive to moisture content or increases as the material
dries, reaching a maximum between 6% and 15% moisture
content; fracture toughness then decreases with further
drying.
Vibration Properties
The vibration properties of primary interest in structural
materials are speed of sound and internal friction (damping
capacity).
Speed of Sound
The speed of sound in a structural material is a function of
the modulus of elasticity and density. In wood, the speed of
sound also varies with grain direction because the transverse
modulus of elasticity is much less than the longitudinal
value (as little as 1/20); the speed of sound across the grain
is about one-fth to one-third of the longitudinal value.
For example, a piece of wood with a longitudinal modulus
of elasticity of 12.4 GPa (1.8 × 10
6
lbf in
–2
) and density of
480 kg m
–3
(30 lb ft
–3
) would have a speed of sound in the
longitudinal direction of about 3,800 m s
–1
(12,500 ft s
–1
).
In the transverse direction, modulus of elasticity would be
about 690 MPa (100 × 10
3
lbf in
–2
) and the speed of sound
approximately 890 m s
–1
(2,900 ft s
–1
).
The speed of sound decreases with increasing temperature
or moisture content in proportion to the inuence of these
variables on modulus of elasticity and density. The speed of
sound decreases slightly with increasing frequency and am-
plitude of vibration, although for most common applications
this effect is too small to be signicant. There is no recog-
nized independent effect of species on the speed of sound.
Variability in the speed of sound in wood is directly related
to the variability of modulus of elasticity and density.
Internal Friction
When solid material is strained, some mechanical energy
is dissipated as heat. Internal friction is the term used to
denote the mechanism that causes this energy dissipation.
Chapter 5 Mechanical Properties of Wood
5–17
Table 5
–
4b. Mechanical properties of some commercially important woods grown in Canada and imported
into the United States (inch–pound)
a
—con.
Common species
names
Moisture
content
Specific
gravity
Static bending
Compression
parallel to
grain
(lbf in
–2
)
Compression
perpendicular
to grain
(lbf in
–2
)
Shear
parallel to
grain
(lbf in
–2
)
Modulus of
rupture
(lbf in
–2
)
Modulus of
elasticity
(10
6
lbf in
–2
)
Sitka Green 0.35 5,400 1.37 2,560 290 630
12% 10,100 1.63 5,480 590 980
White Green 0.35 5,100 1.15 2,470 240 670
12% 9,100 1.45 5,360 500 980
Tamarack Green 0.48 6,800 1.24 3,130 410 920
12% 11,000 1.36 6,510 900 1,300
a
Results of tests on clear, straight-grained specimens. Property values based on ASTM Standard D 2555–88. Information on additional properties
can be obtained from Department of Forestry, Canada, Publication No. 1104. For each species, values in the first line are from tests of green
material; those in the second line are adjusted from the green condition to 12% moisture content using dry to green clear wood property ratios as
reported in ASTM D 2555–88. Specific gravity is based on weight when ovendry and volume when green.
Figure 5–2. Possible crack propagation systems for
wood.

5–18
Table 5–5a. Mechanical properties of some woods imported into the United States other than Canadian imports
(metric)
a
Static bending
Com-
pression
parallel
to grain
(kPa)
Shear
parallel
to grain
(kPa)
Side
hard-
ness
(N)
Sample
origin
b
Common and
botanical names
of species
Moisture
content
Specific
gravity
Modulus
of
rupture
(kPa)
Modulus
of
elasticity
(MPa)
Work to
maximum
load
(kJ m
–3
)
Afrormosia (Pericopsis elata) Green 0.61 102,000 12,200 135 51,600 11,500 7,100 AF
12% 126,900 13,400 127 68,500 14,400 6,900
Albarco (Cariniana spp.) Green 0.48 — — — — — — AM
12% 100,000 10,300 95 47,000 15,900 4,500
Andiroba (Carapa guianensis) Green 0.54 71,000 11,700 68 33,000 8,400 3,900 AM
12% — 106,900 13,800 97 56,000 10,400 5,000
Angelin (Andira inermis) Green 0.65 — — — — — — AF
12% 124,100 17,200 — 63,400 12,700 7,800
Angelique (Dicorynia
guianensis)
Green 0.6 78,600 12,700 83 38,500 9,200 4,900 AM
12% — 120,000 15,100 105 60,500 11,400 5,700
Avodire (Turraeanthus
africanus)
Green 0.48 — — — — — — AF
12% 87,600 10,300 65 49,300 14,000 4,800
Azobe (Lophira alata) Green 0.87 116,500 14,900 83 65,600 14,100 12,900 AF
12% 168,900 17,000 — 86,900 20,400 14,900
Balsa (Ochroma pyramidale) Green 0.16 — — — — — — AM
12% 21,600 3,400 14 14,900 2,100 —
Banak (Virola spp.) Green 0.42 38,600 11,300 28 16,500 5,000 1,400 AM
12% — 75,200 14,100 69 35,400 6,800 2,300
Benge (Guibourtia arnoldiana) Green 0.65 — — — — — — AF
12% 147,500 14,100 — 78,600 14,400 7,800
Bubinga (Guibourtia spp.) Green 0.71 — — — — — — AF
12% 155,800 17,100 — 72,400 21,400 12,000
Bulletwood (Manilkara Green 0.85 119,300 18,600 94 59,900 13,100 9,900 AM
bidentata) 12% 188,200 23,800 197 80,300 17,200 14,200
Cativo (Prioria copaifera) Green 0.4 40,700 6,500 37 17,000 5,900 2,000 AM
12% — 59,300 7,700 50 29,600 7,300 2,800
Ceiba (Ceiba pentandra) Green 0.25 15,200 2,800 8 7,300 2,400 1,000 AM
12% 29,600 3,700 19 16,400 3,800 1,100
Courbaril (Hymenaea Green 0.71 88,900 12,700 101 40,000 12,200 8,800 AM
courbaril) 12% — 133,800 14,900 121 65,600 17,000 10,500
Cuangare (Dialyanthera spp.) Green 0.31 27,600 7,000 — 14,300 4,100 1,000 AM
12% 50,300 10,500 — 32,800 5,700 1,700
Cypress, Mexican (Cupressus Green 0.39 42,700 6,300 — 19,900 6,600 1,500 AF
lustianica) 12% 71,000 7,000 — 37,100 10,900 2,000
Degame (Calycophyllum Green 0.67 98,600 13,300 128 42,700 11,400 7,300 AM
candidissimum) 12% 153,800 15,700 186 66,700 14,600 8,600
Determa (Ocotea rubra) Green 0.52 53,800 10,100 33 25,900 5,900 2,300 AM
12% 72,400 12,500 44 40,000 6,800 2,900
Ekop (Tetraberlinia Green 0.6 — — — — — — AF
tubmaniana) 12% 115,100 15,200 — 62,100 — —
Goncalo alves (Astronium Green 0.84 83,400 13,400 46 45,400 12,100 8,500 AM
graveolens) 12% — 114,500 15,400 72 71,200 13,500 9,600
Greenheart (Chlorocardium Green 0.8 133,100 17,000 72 64,700 13,300 8,400 AM
rodiei) 12% 171,700 22,400 175 86,300 18,100 10,500
Hura (Hura crepitans) Green 0.38 43,400 7,200 41 19,200 5,700 2,000 AM
12% 60,000 8,100 46 33,100 7,400 2,400
General Technical Report FPL–GTR–190

Chapter 5 Mechanical Properties of Wood
5–19
Table 5–5a. Mechanical properties of some woods imported into the United States other than Canadian imports
(metric)
a
—con.
Static bending
Com-
pression
parallel
to grain
(kPa)
Shear
parallel
to grain
(kPa)
Side
hard-
ness
(N)
Sample
origin
b
Common and botanical
names of species
Moisture
content
Specific
gravity
Modulus
of
rupture
(kPa)
Modulus
of
elasticity
(MPa)
Work to
maximum
load
(kJ m
–3
)
Llomba (Pycnanthus Green 0.40 37,900 7,900 — 20,000 5,800 2,100 AF
angolensis) 12% 68,300 11,000 — 38,300 8,900 2,700
Ipe (Tabebuia spp., Green 0.92 155,800 20,100 190 71,400 14,600 13,600 AM
lapacho group) 12% 175,100 21,600 152 89,700 14,200 16,400
Iroko (Chlorophora spp.) Green 0.54 70,300 8,900 72 33,900 9,000 4,800 AF
12% 85,500 10,100 62 52,300 12,400 5,600
Jarrah (Eucalyptus marginata) Green 0.67 68,300 10,200 — 35,800 9,100 5,700 AS
12% — 111,700 13,000 — 61,200 14,700 8,500
Jelutong (Dyera costulata) Green 0.36 38,600 8,000 39 21,000 5,200 1,500 AS
15% 50,300 8,100 44 27,000 5,800 1,700
Kaneelhart (Licaria spp.) Green 0.96 153,800 26,300 94 92,300 11,600 9,800 AM
12% 206,200 28,000 121 120,000 13,600 12,900
Kapur (Dryobalanops spp.) Green 0.64 88,300 11,000 108 42,900 8,100 4,400 AS
12% 126,200 13,000 130 69,600 13,700 5,500
Karri (Eucalyptus diversicolor) Green 0.82 77,200 13,400 80 37,600 10,400 6,000 AS
12% 139,000 17,900 175 74,500 16,700 9,100
Kempas (Koompassia Green 0.71 100,000 16,600 84 54,700 10,100 6,600 AS
malaccensis) 12% 122,000 18,500 106 65,600 12,300 7,600
Keruing (Dipterocarpus spp.) Green 0.69 82,000 11,800 96 39,200 8,100 4,700 AS
12% 137,200 14,300 162 72,400 14,300 5,600
Lignumvitae (Guaiacum spp.) Green 1.05 — — — — — — AM
12% — — — — 78,600 — 20,000
Limba (Terminalia superba) Green 0.38 41,400 5,300 53 19,200 6,100 1,800 AF
12% 60,700 7,000 61 32,600 9,700 2,200
Macawood (Platymiscium spp.) Green 0.94 153,800 20,800 — 72,700 12,700 14,800 AM
12% 190,300 22,100 — 111,000 17,500 14,000
Mahogany, African Green 0.42 51,000 7,900 49 25,700 6,400 2,800 AF
(Khaya spp.) 12% 73,800 9,700 57 44,500 10,300 3,700
Mahogany, true Green 0.45 62,100 9,200 63 29,900 8,500 3,300 AM
(Swietenia macrophylla) 12% — 79,300 10,300 52 46,700 8,500 3,600
Manbarklak (Eschweilera spp.) Green 0.87 117,900 18,600 120 50,600 11,200 10,100 AM
12% 182,700 21,600 230 77,300 14,300 15,500
Manni (Symphonia globulifera) Green 0.58 77,200 13,500 77 35,600 7,900 4,200 AM
12% 116,500 17,000 114 60,800 9,800 5,000
Marishballi (Lincania spp.) Green 0.88 117,900 20,200 92 52,300 11,200 10,000 AM
12% 191,000 23,000 98 92,300 12,100 15,900
Merbau (Intsia spp.) Green 0.64 88,900 13,900 88 46,700 10,800 6,100 AS
15% — 115,800 15,400 102 58,200 12,500 6,700
Mersawa (Anisoptera spp.) Green 0.52 55,200 12,200 — 27,300 5,100 3,900 AS
12% 95,100 15,700 — 50,800 6,100 5,700
Mora (Mora spp.) Green 0.78 86,900 16,100 93 44,100 9,700 6,400 AM
12% 152,400 20,400 128 81,600 13,100 10,200
Oak (Quercus spp.) Green 0.76 — — — — — — AM
12% 158,600 20,800 114 — — 11,100
Obeche (Triplochiton Green 0.3 35,200 5,000 43 17,700 4,600 1,900 AF
scleroxylon) 12% 51,000 5,900 48 27,100 6,800 1,900

5–20
Table 5–5a. Mechanical properties of some woods imported into the United States other than Canadian imports
(metric)
a
—con.
Static bending
Com-
pression
parallel
to grain
(kPa)
Shear
parallel
to grain
(kPa)
Side
hard-
ness
(N)
Sample
origin
b
Common and botanical
names of species
Moisture
content
Specific
gravity
Modulus
of
rupture
(kPa)
Modulus of
elasticity
(MPa)
Work to
maximum
load
(kJ m
–3
)
Okoume (Aucoumea Green 0.33 — — — — — — AF
klaineana) 12% 51,000 7,900 — 27,400 6,700 1,700
Opepe (Nauclea diderrichii) Green 0.63 93,800 11,900 84 51,600 13,100 6,800 AF
12% 120,000 13,400 99 71,700 17,100 7,300
Ovangkol (Guibourtia ehie) Green 0.67 — — — — — — AF
12% 116,500 17,700 — 57,200 — —
Para-angelim (Hymenolobium Green 0.63 100,700 13,400 88 51,400 11,000 7,700 AM
excelsum) 12% 121,300 14,100 110 62,000 13,900 7,700
Parana-pine (Araucaria Green 0.46 49,600 9,300 67 27,600 6,700 2,500 AM
augustifolia) 12% — 93,100 11,100 84 52,800 11,900 3,500
Pau marfim (Balfourodendron Green 0.73 99,300 11,400 — 41,900 — — AM
riedelianum) 15% 130,300 — — 56,500 — —
Peroba de campos Green 0.62 — — — — — — AM
(Paratecoma peroba) 12% 106,200 12,200 70 61,200 14,700 7,100
Peroba rosa (Aspidosperma Green 0.66 75,200 8,900 72 38,200 13,000 7,000 AM
spp., peroba group) 12% 83,400 10,500 63 54,600 17,200 7,700
Pilon (Hyeronima spp.) Green 0.65 73,800 13,000 57 34,200 8,300 5,400 AM
12% 125,500 15,700 83 66,300 11,900 7,600
Pine, Caribbean (Pinus Green 0.68 77,200 13,000 74 33,800 8,100 4,400 AM
caribaea) 12% — 115,100 15,400 119 58,900 14,400 5,500
Pine, ocote (Pinus oocarpa) Green 0.55 55,200 12,000 48 25,400 7,200 2,600 AM
12% — 102,700 15,500 75 53,000 11,900 4,000
Pine, radiata (Pinus radiata) Green 0.42 42,100 8,100 — 19,200 5,200 2,100 AS
12% — 80,700 10,200 — 41,900 11,000 3,300
Piquia (Caryocar spp.) Green 0.72 85,500 12,500 58 43,400 11,300 7,700 AM
12% 117,200 14,900 109 58,000 13,700 7,700
Primavera (Tabebuia Green 0.4 49,600 6,800 50 24,200 7,100 3,100 AM
donnell–smithii) 12% 65,500 7,200 44 38,600 9,600 2,900
Purpleheart (Peltogyne spp.) Green 0.67 94,000 13,800 102 48,400 11,300 8,100 AM
12% 132,400 15,700 121 71,200 15,300 8,300
Ramin (Gonystylus bancanus) Green 0.52 67,600 10,800 62 37,200 6,800 2,800 AS
12% — 127,600 15,000 117 69,500 10,500 5,800
Robe (Tabebuia spp., Green 0.52 74,500 10,000 81 33,900 8,600 4,000 AM
roble group) 12% 95,100 11,000 86 50,600 10,000 4,300
Rosewood, Brazilian Green 0.8 97,200 12,700 91 38,000 16,300 10,900 AM
(Dalbergia nigra) 12% — 131,000 13,000 — 66,200 14,500 12,100
Rosewood, Indian (Dalbergia Green 0.75 63,400 8,200 80 31,200 9,700 6,900 AS
latifolia) 12% 116,500 12,300 90 63,600 14,400 14,100
Sande (Brosimum spp., Green 0.49 58,600 13,400 — 31,000 7,200 2,700 AM
utile group) 12% 98,600 16,500 — 56,700 8,900 4,000
Santa Maria (Calophyllum Green 0.52 72,400 11,000 88 31,400 8,700 4,000 AM
brasiliense) 12% — 100,700 12,600 111 47,600 14,300 5,100
Sapele (Entandrophragma Green 0.55 70,300 10,300 72 34,500 8,600 4,500 AF
cylindricum) 12% — 105,500 12,500 108 56,300 15,600 6,700
Sepetir (Pseudosindora Green 0.56 77,200 10,800 92 37,600 9,000 4,200 AS
palustris) 12% 118,600 13,600 92 61,200 14,000 6,300
General Technical Report FPL–GTR–190

The internal friction mechanism in wood is a complex func-
tion of temperature and moisture content. In general, there
is a value of moisture content at which internal friction is
minimum. On either side of this minimum, internal friction
increases as moisture content varies down to zero or up to
the ber saturation point. The moisture content at which
minimum internal friction occurs varies with temperature.
At room temperature (23 °C (73 °F)), the minimum occurs
at about 6% moisture content; at -20 °C (-4 °F), it occurs at
about 14% moisture content, and at 70 °C (158 °F), at about
4%. At 90 °C (194 °F), the minimum is not well dened and
occurs near zero moisture content.
Similarly, there are temperatures at which internal friction
is minimum, and the temperatures of minimum internal
friction vary with moisture content. The temperatures of
minimum internal friction increase as moisture content de-
creases. For temperatures above 0 °C (32 °F) and moisture
content greater than about 10%, internal friction increases
strongly as temperature increases, with a strong positive
interaction with moisture content. For very dry wood, there
is a general tendency for internal friction to decrease as the
temperature increases.
The value of internal friction, expressed by logarithmic dec-
rement, ranges from about 0.1 for hot, moist wood to less
than 0.02 for hot, dry wood. Cool wood, regardless of mois-
ture content, would have an intermediate value.
Mechanical Properties of Clear
Straight-Grained Wood
The mechanical properties listed in Table 5–1 to Table 5–9
are based on a variety of sampling methods. Generally, the
most extensive sampling is represented in Tables 5–3 and
5–4. Values in Table 5–3 are averages derived for a number
of species grown in the United States. The tabulated value
is an estimate of the average clear wood property of the spe-
cies. Many values were obtained from test specimens taken
at a height of 2.4 to 5 m (8 to 16 ft) above the stump of the
tree. Values reported in Table 5–4 represent estimates of the
average clear wood properties of species grown in Canada
and commonly imported into the United States.
Methods of data collection and analysis changed over the
years during which the data in Tables 5–3 and 5–4 were
collected. In addition, the character of some forests has
changed with time. Because not all the species were
Chapter 5 Mechanical Properties of Wood
5–21
Table 5–5a. Mechanical properties of some woods imported into the United States other than Canadian imports
(metric)
a
—con.
Static bending
Com-
pression
parallel
to grain
(kPa)
Shear
parallel
to grain
(kPa)
Side
hard-
ness
(N)
Sample
origin
b
Common and botanical
names of species
Moisture
content
Specific
gravity
Modulus
of
rupture
(kPa)
Modulus
of
elasticity
(MPa)
Work to
maximum
load
(kJ m
–3
)
Shorea (Shorea spp., Green 0.68 80,700 14,500 — 37,100 9,900 6,000 AS
baulau group) 12% 129,600 18,000 — 70,200 15,100 7,900
Shorea, lauan–meranti group
Dark red meranti Green 0.46 64,800 10,300 59 32,500 7,700 3,100 AS
12% 87,600 12,200 95 50,700 10,000 3,500
Light red meranti Green 0.34 45,500 7,200 43 23,000 4,900 2,000 AS
12% 65,500 8,500 59 40,800 6,700 2,000
White meranti Green 0.55 67,600 9,000 57 37,900 9,100 4,400 AS
15% 85,500 10,300 79 43,800 10,600 5,100
Yellow meranti Green 0.46 55,200 9,000 56 26,800 7,100 3,300 AS
12% 78,600 10,700 70 40,700 10,500 3,400
Spanish-cedar (Cedrela spp.) Green 0.41 51,700 9,000 49 23,200 6,800 2,400 AM
12% — 79,300 9,900 65 42,800 7,600 2,700
Sucupira (Bowdichia spp.) Green 0.74 118,600 15,700 — 67,100 — — AM
15% 133,800 — — 76,500 — —
Sucupira (Diplotropis purpurea) Green 0.78 120,000 18,500 90 55,300 12,400 8,800 AM
12% 142,000 19,800 102 83,700 13,500 9,500
Teak (Tectona grandis) Green 0.55 80,000 9,400 92 41,100 8,900 4,100 AS
12% 100,700 10,700 83 58,000 13,000 4,400
Tornillo (Cedrelinga Green 0.45 57,900 — — 28,300 8,100 3,900 AM
cateniformis) 12% — — — — — — —
Wallaba (Eperua spp.) Green 0.78 98,600 16,100 — 55,400 — 6,900 AM
12% — 131,700 15,700 — 74,200 — 9,100
a
Results of tests on clear, straight-grained specimens. Property values were taken from world literature (not obtained from experiments conducted at the
Forest Products Laboratory). Other species may be reported in the world literature, as well as additional data on many of these species. Some property
values have been adjusted to 12% moisture content.
b
AF is Africa; AM, America; AS, Asia.

5–22
Table 5–5b. Mechanical properties of some woods imported into the United States other than Canadian imports
(inch–pound)
a
Static bending
Com-
pression
parallel
to grain
(lbf in
–2
)
Shear
parallel
to grain
(lbf in
–2
)
Side
hard-
ness
(lbf)
Sample
origin
b
Common and botanical
names of species
Moisture
content
Specific
gravity
Modulus
of
rupture
(lbf in
–2
)
Modulus
of
elasticity
(10
6
lbf in
–2
)
Work to
maximum
load
(in-lbf in
–3
)
Afrormosia (Pericopsis elata) Green 0.61 14,800 1.77 19.5 7,490 1,670 1,600 AF
12% 18,400 1.94 18.4 9,940 2,090 1,560
Albarco (Cariniana spp.) Green 0.48 — — — — — — AM
12% 14,500 1.5 13.8 6,820 2,310 1,020
Andiroba (Carapa guianensis) Green 0.54 10,300 1.69 9.8 4,780 1,220 880 AM
12% — 15,500 2 14 8,120 1,510 1,130
Angelin (Andira inermis) Green 0.65 — — — — — — AF
12% 18,000 2.49 — 9,200 1,840 1,750
Angelique (Dicorynia Green 0.6 11,400 1.84 12 5,590 1,340 1,100 AM
guianensis) 12% — 17,400 2.19 15.2 8,770 1,660 1,290
Avodire (Turraeanthus Green 0.48 — — — — — — AF
africanus) 12% 12,700 1.49 9.4 7,150 2,030 1,080
Azobe (Lophira alata) Green 0.87 16,900 2.16 12 9,520 2,040 2,890 AF
12% 24,500 2.47 — 12,600 2,960 3,350
Balsa (Ochroma pyramidale) Green 0.16 — — — — — — AM
12% 3,140 0.49 2.1 2,160 300 —
Banak (Virola spp.) Green 0.42 5,600 1.64 4.1 2,390 720 320 AM
12% — 10,900 2.04 10 5,140 980 510
Benge (Guibourtia arnoldiana) Green 0.65 — — — — — — AF
12% 21,400 2.04 — 11,400 2,090 1,750
Bubinga (Guibourtia spp.) Green 0.71 — — — — — — AF
12% 22,600 2.48 — 10,500 3,110 2,690
Bulletwood (Manilkara Green 0.85 17,300 2.7 13.6 8,690 1,900 2,230 AM
bidentata) 12% 27,300 3.45 28.5 11,640 2,500 3,190
Cativo (Prioria copaifera) Green 0.4 5,900 0.94 5.4 2,460 860 440 AM
12% — 8,600 1.11 7.2 4,290 1,060 630
Ceiba (Ceiba pentandra) Green 0.25 2,200 0.41 1.2 1,060 350 220 AM
12% 4,300 0.54 2.8 2,380 550 240
Courbaril (Hymenaea Green 0.71 12,900 1.84 14.6 5,800 1,770 1,970 AM
courbaril) 12% — 19,400 2.16 17.6 9,510 2,470 2,350
Cuangare (Dialyanthera spp.) Green 0.31 4,000 1.01 — 2,080 590 230 AM
12% 7,300 1.52 — 4,760 830 380
Cypress, Mexican (Cupressus Green 0.39 6,200 0.92 — 2,880 950 340 AF
lustianica) 12% 10,300 1.02 — 5,380 1,580 460
Degame (Calycophyllum Green 0.67 14,300 1.93 18.6 6,200 1,660 1,630 AM
candidissimum) 12% 22,300 2.27 27 9,670 2,120 1,940
Determa (Ocotea rubra) Green 0.52 7,800 1.46 4.8 3,760 860 520 AM
12% 10,500 1.82 6.4 5,800 980 660
Ekop (Tetraberlinia Green 0.6 — — — — — — AF
tubmaniana) 12% 16,700 2.21 — 9,010 — —
Goncalo alves (Astronium Green 0.84 12,100 1.94 6.7 6,580 1,760 1,910 AM
graveolens) 12% — 16,600 2.23 10.4 10,320 1,960 2,160
Greenheart (Chlorocardium rodiei) Green 0.8 19,300 2.47 10.5 9,380 1,930 1,880 AM
12% 24,900 3.25 25.3 12,510 2,620 2,350
Hura (Hura crepitans) Green 0.38 6,300 1.04 5.9 2,790 830 440 AM
12% 8,700 1.17 6.7 4,800 1,080 550
General Technical Report FPL–GTR–190

Chapter 5 Mechanical Properties of Wood
5–23
Table 5–5b. Mechanical properties of some woods imported into the United States other than Canadian imports
(inch–pound)
a
—con.
Static bending
Com-
pression
parallel
to grain
(lbf in
–2
)
Shear
parallel
to grain
(lbf in
–2
)
Side
hard-
ness
(lbf)
Sample
origin
b
Common and botanical
names of species
Moisture
content
Specific
gravity
Modulus
of
rupture
(lbf in
–2
)
Modulus
of
elasticity
(10
6
lbf in
–2
)
Work to
maximum
load
(in-lbf in
–3
)
Ilomba (Pycnanthus Green 0.4 5,500 1.14 — 2,900 840 470 AF
angolensis) 12% 9,900 1.59 — 5,550 1,290 610
Ipe (Tabebuia spp., Green 0.92 22,600 2.92 27.6 10,350 2,120 3,060 AM
lapacho group) 12% 25,400 3.14 22 13,010 2,060 3,680
Iroko (Chlorophora spp.) Green 0.54 10,200 1.29 10.5 4,910 1,310 1,080 AF
12% 12,400 1.46 9 7,590 1,800 1,260
Jarrah (Eucalyptus marginata) Green 0.67 9,900 1.48 — 5,190 1,320 1,290 AS
12% — 16,200 1.88 — 8,870 2,130 1,910
Jelutong (Dyera costulata) Green 0.36 5,600 1.16 5.6 3,050 760 330 AS
15% 7,300 1.18 6.4 3,920 840 390
Kaneelhart (Licaria spp.) Green 0.96 22,300 3.82 13.6 13,390 1,680 2,210 AM
12% 29,900 4.06 17.5 17,400 1,970 2,900
Kapur (Dryobalanops spp.) Green 0.64 12,800 1.6 15.7 6,220 1,170 980 AS
12% 18,300 1.88 18.8 10,090 1,990 1,230
Karri (Eucalyptus diversicolor) Green 0.82 11,200 1.94 11.6 5,450 1,510 1,360 AS
12% 20,160 2.6 25.4 10,800 2,420 2,040
Kempas (Koompassia Green 0.71 14,500 2.41 12.2 7,930 1,460 1,480 AS
malaccensis) 12% 17,700 2.69 15.3 9,520 1,790 1,710
Keruing (Dipterocarpus spp.) Green 0.69 11,900 1.71 13.9 5,680 1,170 1,060 AS
12% 19,900 2.07 23.5 10,500 2,070 1,270
Lignumvitae (Guaiacum spp.) Green 1.05 — — — — — — AM
12% — — — — 11,400 — 4,500
Limba (Terminalia superba) Green 0.38 6,000 0.77 7.7 2,780 880 400 AF
12% 8,800 1.01 8.9 4,730 1,410 490
Macawood (Platymiscium spp.) Green 0.94 22,300 3.02 — 10,540 1,840 3,320 AM
12% 27,600 3.2 — 16,100 2,540 3,150
Mahogany, African (Khaya spp.) Green 0.42 7,400 1.15 7.1 3,730 931 640 AF
12% 10,700 1.4 8.3 6,460 1,500 830
Mahogany, true Green 0.45 9,000 1.34 9.1 4,340 1,240 740 AM
(Swietenia macrophylla) 12% — 11,500 1.5 7.5 6,780 1,230 800
Manbarklak (Eschweilera spp.) Green 0.87 17,100 2.7 17.4 7,340 1,630 2,280 AM
12% 26,500 3.14 33.3 11,210 2,070 3,480
Manni (Symphonia globulifera) Green 0.58 11,200 1.96 11.2 5,160 1,140 940 AM
12% 16,900 2.46 16.5 8,820 1,420 1,120
Marishballi (Lincania spp.) Green 0.88 17,100 2.93 13.4 7,580 1,620 2,250 AM
12% 27,700 3.34 14.2 13,390 1,750 3,570
Merbau (Intsia spp.) Green 0.64 12,900 2.02 12.8 6,770 1,560 1,380 AS
15% — 16,800 2.23 14.8 8,440 1,810 1,500
Mersawa (Anisoptera spp.) Green 0.52 8,000 1.77 — 3,960 740 880 AS
12% 13,800 2.28 — 7,370 890 1,290
Mora (Mora spp.) Green 0.78 12,600 2.33 13.5 6,400 1,400 1,450 AM
12% 22,100 2.96 18.5 11,840 1,900 2,300
Oak (Quercus spp.) Green 0.76 — — — — — — AM
12% 23,000 3.02 16.5 — — 2,500
Obeche (Triplochiton Green 0.3 5,100 0.72 6.2 2,570 660 420 AF
scleroxylon) 12% 7,400 0.86 6.9 3,930 990 430

Table 5–5b. Mechanical properties of some woods imported into the United States other than Canadian imports
(inch–pound)
a
—con.
Static bending
Com-
pression
parallel
to grain
(lbf in
–2
)
Shear
parallel
to grain
(lbf in
–2
)
Side
hard-
ness
(lbf)
Sample
origin
b
Common and botanical
names of species
Moisture
content
Specific
gravity
Modulus
of
rupture
(lbf in
–2
)
Modulus
of
elasticity
(10
6
lbf in
–2
)
Work to
maximum
load
(in-lbf in
–3
)
Okoume (Aucoumea Green 0.33 — — — — — — AF
klaineana) 12% 7,400 1.14 — 3,970 970 380
Opepe (Nauclea diderrichii) Green 0.63 13,600 1.73 12.2 7,480 1,900 1,520 AF
12% 17,400 1.94 14.4 10,400 2,480 1,630
Ovangkol (Guibourtia ehie) Green 0.67 — — — — — — AF
12% 16,900 2.56 — 8,300 — —
Para-angelim (Hymenolobium Green 0.63 14,600 1.95 12.8 7,460 1,600 1,720 AM
excelsum) 12% 17,600 2.05 15.9 8,990 2,010 1,720
Parana-pine (Araucaria Green 0.46 7,200 1.35 9.7 4,010 970 560 AM
augustifolia) 12% — 13,500 1.61 12.2 7,660 1,730 780
Pau marfim (Balfourodendron Green 0.73 14,400 1.66 — 6,070 — — AM
riedelianum) 15% 18,900 — — 8,190 — —
Peroba de campos Green 0.62 — — — — — — AM
(Paratecoma peroba) 12% 15,400 1.77 10.1 8,880 2,130 1,600
Peroba rosa (Aspidosperma Green 0.66 10,900 1.29 10.5 5,540 1,880 1,580 AM
spp., peroba group) 12% 12,100 1.53 9.2 7,920 2,490 1,730
Pilon (Hyeronima spp.) Green 0.65 10,700 1.88 8.3 4,960 1,200 1,220 AM
12% 18,200 2.27 12.1 9,620 1,720 1,700
Pine, Caribbean (Pinus caribaea) Green 0.68 11,200 1.88 10.7 4,900 1,170 980 AM
12% — 16,700 2.24 17.3 8,540 2,090 1,240
Pine, ocote (Pinus oocarpa) Green 0.55 8,000 1.74 6.9 3,690 1,040 580 AM
12% — 14,900 2.25 10.9 7,680 1,720 910
Pine, radiata (Pinus radiata) Green 0.42 6,100 1.18 — 2,790 750 480 AS
12% — 11,700 1.48 — 6,080 1,600 750
Piquia (Caryocar spp.) Green 0.72 12,400 1.82 8.4 6,290 1,640 1,720 AM
12% 17,000 2.16 15.8 8,410 1,990 1,720
Primavera (Tabebuia Green 0.4 7,200 0.99 7.2 3,510 1,030 700 AM
donnell–smithii) 12% 9,500 1.04 6.4 5,600 1,390 660
Purpleheart (Peltogyne spp.) Green 0.67 13,700 2 14.8 7,020 1,640 1,810 AM
12% 19,200 2.27 17.6 10,320 2,220 1,860
Ramin (Gonystylus bancanus) Green 0.52 9,800 1.57 9 5,390 990 640 AS
12% — 18,500 2.17 17 10,080 1,520 1,300
Robe (Tabebuia spp., Green 0.52 10,800 1.45 11.7 4,910 1,250 910 AM
roble group) 12% 13,800 1.6 12.5 7,340 1,450 960
Rosewood, Brazilian Green 0.8 14,100 1.84 13.2 5,510 2,360 2,440 AM
(Dalbergia nigra) 12% — 19,000 1.88 — 9,600 2,110 2,720
Rosewood, Indian (Dalbergia Green 0.75 9,200 1.19 11.6 4,530 1,400 1,560 AS
latifolia) 12% 16,900 1.78 13.1 9,220 2,090 3,170
Sande (Brosimum spp., Green 0.49 8,500 1.94 — 4,490 1,040 600 AM
utile group) 12% 14,300 2.39 — 8,220 1,290 900
Santa Maria (Calophyllum Green 0.52 10,500 1.59 12.7 4,560 1,260 890 AM
brasiliense) 12% — 14,600 1.83 16.1 6,910 2,080 1,150
Sapele (Entandrophragma Green 0.55 10,200 1.49 10.5 5,010 1,250 1,020 AF
cylindricum) 12% — 15,300 1.82 15.7 8,160 2,260 1,510
Sepetir (Pseudosindora palustris) Green 0.56 11,200 1.57 13.3 5,460 1,310 950 AS
12% 17,200 1.97 13.3 8,880 2,030 1,410
5–24
General Technical Report FPL–GTR–190

reevaluated to reect these changes, the appropriateness of
the data should be reviewed when used for critical applica-
tions such as stress grades of lumber.
Values reported in Table 5–5 were collected from the world
literature; thus, the appropriateness of these properties to
represent a species is not known. The properties reported
in Tables 5–1, 5–2, 5–5, and 5–7 to 5–10 may not neces-
sarily represent average species characteristics because of
inadequate sampling; however, they do suggest the relative
inuence of species and other specimen parameters on the
mechanical behavior recorded.
Variability in properties can be important in both production
and consumption of wood products. The fact that a piece
may be stronger, harder, or stiffer than the average is often
of less concern to the user than if the piece is weaker; how-
ever, this may not be true if lightweight material is selected
for a specic purpose or if harder or tougher material is
difcult to work. Some indication of the spread of property
values is therefore desirable. Average coefcients of varia-
tion for many mechanical properties are presented in
Table 5–6.
The mechanical properties reported in the tables are sig-
nicantly affected by specimen moisture content at time of
test. Some tables include properties that were evaluated at
different moisture levels; these moisture levels are reported.
As indicated in the tables, many of the dry test data were
adjusted to a common moisture content base of 12%.
Specic gravity is reported in many tables because this
property is used as an index of clear wood mechanical
properties. The specic gravity values given in Tables 5–3
and 5–4 represent the estimated average clear wood specic
gravity of the species. In the other tables, specic gravity
values represent only the specimens tested. The variability
of specic gravity, represented by the coefcient of varia-
tion derived from tests on 50 species, is included in Table
5–6.
Mechanical and physical properties as measured and re-
ported often reect not only the characteristics of the wood
but also the inuence of the shape and size of the test speci-
men and the test mode. The test methods used to establish
properties in Tables 5–3, 5–4, and 5–7 to 5–9 are based on
standard procedures (ASTM D 143). Test methods for
Table 5–5b. Mechanical properties of some woods imported into the United States other than Canadian imports
(inch–pound)
a
—con.
Static bending
Com-
pression
parallel
to grain
(lbf in
–2
)
Sample
origin
b
Common and botanical
names of species
Moisture
content
Specific
gravity
Modulus
of
rupture
(lbf in
–2
)
Modulus
of
elasticity
(10
6
lbf in
–2
)
Work to
maximum
load
(in-lbf in
–3
)
Shear
parallel
to grain
(lbf in
–2
)
Side
hard-
ness
(lbf)
Shorea (Shorea spp., Green 0.68 11,700 2.1 — 5,380 1,440 1,350 AS
bullau group) 12% 18,800 2.61 — 10,180 2,190 1,780
Shorea, lauan–meranti group
Dark red meranti Green 0.46 9,400 1.5 8.6 4,720 1,110 700 AS
12% 12,700 1.77 13.8 7,360 1,450 780
Light red meranti Green 0.34 6,600 1.04 6.2 3,330 710 440 AS
12% 9,500 1.23 8.6 5,920 970 460
White meranti Green 0.55 9,800 1.3 8.3 5,490 1,320 1,000 AS
15% 12,400 1.49 11.4 6,350 1,540 1,140
Yellow meranti Green 0.46 8,000 1.3 8.1 3,880 1,030 750 AS
12% 11,400 1.55 10.1 5,900 1,520 770
Spanish-cedar (Cedrela spp.) Green 0.41 7,500 1.31 7.1 3,370 990 550 AM
12% — 11,500 1.44 9.4 6,210 1,100 600
Sucupira (Bowdichia spp.) Green 0.74 17,200 2.27 — 9,730 — — AM
15% 19,400 — — 11,100 — —
Sucupira (Diplotropis purpurea) Green 0.78 17,400 2.68 13 8,020 1,800 1,980 AM
12% 20,600 2.87 14.8 12,140 1,960 2,140
Teak (Tectona grandis) Green 0.55 11,600 1.37 13.4 5,960 1,290 930 AS
12% 14,600 1.55 12 8,410 1,890 1,000
Tornillo (Cedrelinga Green 0.45 8,400 — — 4,100 1,170 870 AM
cateniformis) 12% — — — — — — —
Wallaba (Eperua spp.) Green 0.78 14,300 2.33 — 8,040 — 1,540 AM
12% — 19,100 2.28 — 10,760 — 2,040
a
Results of tests on clear, straight-grained specimens. Property values were taken from world literature (not obtained from experiments conducted at the
Forest Products Laboratory). Other species may be reported in the world literature, as well as additional data on many of these species. Some property
values have been adjusted to 12% moisture content.
b
AF is Africa; AM, America; AS, Asia.
Chapter 5 Mechanical Properties of Wood
5–25

properties presented in other tables are referenced in the
selected bibliography at the end of this chapter.
Common names of species listed in the tables conform to
standard nomenclature of the U.S. Forest Service. Other
names may be used locally for a species. Also, one common
name may be applied to groups of species for marketing.
Natural Characteristics Affecting
Mechanical Properties
Clear straight-grained wood is used for determining funda-
mental mechanical properties; however, because of natural
growth characteristics of trees, wood products vary in spe-
cic gravity, may contain cross grain, or may have knots
and localized slope of grain. Natural defects such as pitch
pockets may occur as a result of biological or climatic ele-
ments inuencing the living tree. These wood characteristics
must be taken into account in assessing actual properties or
estimating actual performance of wood products.
Specic Gravity
The substance of which wood is composed is actually heavi-
er than water; its specic gravity is about 1.5 regardless of
wood species. In spite of this, dry wood of most species
oats in water, and it is thus evident that part of the volume
of a piece of wood is occupied by cell cavities and pores.
Variations in the size of these openings and in the thickness
of the cell walls cause some species to have more wood
substance per unit volume than other species and therefore
higher specic gravity. Thus, specic gravity is an excellent
index of the amount of wood substance contained in a piece
of wood; it is a good index of mechanical properties as long
as the wood is clear, straight grained, and free from defects.
However, specic gravity values also reect the presence of
gums, resins, and extractives, which contribute little to me-
chanical properties.
Approximate relationships between various mechanical
properties and specic gravity for clear straight-grained
wood of hardwoods and softwoods are given in Table 5–11
as power functions. Those relationships are based on aver-
age values for the 43 softwood and 66 hardwood species
presented in Table 5–3. The average data vary around the
relationships, so that the relationships do not accurately
predict individual average species values or an individual
specimen value. In fact, mechanical properties within a spe-
cies tend to be linearly, rather than curvilinearly, related to
specic gravity; where data are available for individual spe-
cies, linear analysis is suggested.
Knots
A knot is that portion of a branch that has become incorpo-
rated in the bole of a tree. The inuence of a knot on the me-
chanical properties of a wood member is due to the interrup-
tion of continuity and change in the direction of wood bers
Table 5–6. Average coefficients of variation for some
mechanical properties of clear wood
Property
Coefficient
of variation
a
(%)
16
22
34
25
18
28
14
25
20
34
Static bending
Modulus of rupture
Modulus of elasticity
Work to maximum load
Impact bending
Compression parallel to grain
Compression perpendicular to grain
Shear parallel to grain, maximum shearing strength
Tension perpendicular to grain
Side hardness
Toughness
Specific gravity
10
a
Values based on results of tests of green wood from approximately
50 species. Values for wood adjusted to 12% moisture content may be
assumed to be approximately of the same magnitude.
Table 5–7. Average parallel-to-grain tensile
strength of some wood species
a
Species
Tensile strength
(kPa (lb in
–2
))
Hardwoods
Beech, American 86,200 (12,500)
Elm, cedar 120,700 (17,500)
Maple, sugar 108,200 (15,700)
Oak
Overcup 77,900 (11,300)
Pin 112,400 (16,300)
Poplar, balsam 51,000 (7,400)
Sweetgum 93,800 (13,600)
Willow, black 73,100 (10,600)
Yellow-poplar 109,600 (15,900)
Softwoods
Baldcypress 58,600 (8,500)
Cedar
Port-Orford 78,600 (11,400)
Western redcedar 45,500 (6,600)
Douglas-fir, interior north 107,600 (15,600)
Fir
California red 77,900 (11,300)
Pacific silver 95,100 (13,800)
Hemlock, western 89,600 (13,000)
Larch, western 111,700 (16,200)
Pine
Eastern white 73,100 (10,600)
Loblolly 80,000 (11,600)
Ponderosa 57,900 (8,400)
Virginia 94,500 (13,700)
Redwood
Virgin 64,800 (9,400)
Young growth 62,700 (9,100)
Spruce
Engelmann 84,800 (12,300)
Sitka 59,300 (8,600)
a
Results of tests on clear, straight-grained specimens tested green.
For hardwood species, strength of specimens tested at 12% moisture
content averages about 32% higher; for softwoods, about 13%
higher.
5–26
Errata, 2018: Corrected Table 5-6 entry to "Tension perpendicular to grain."
General Technical Report FPL–GTR–190
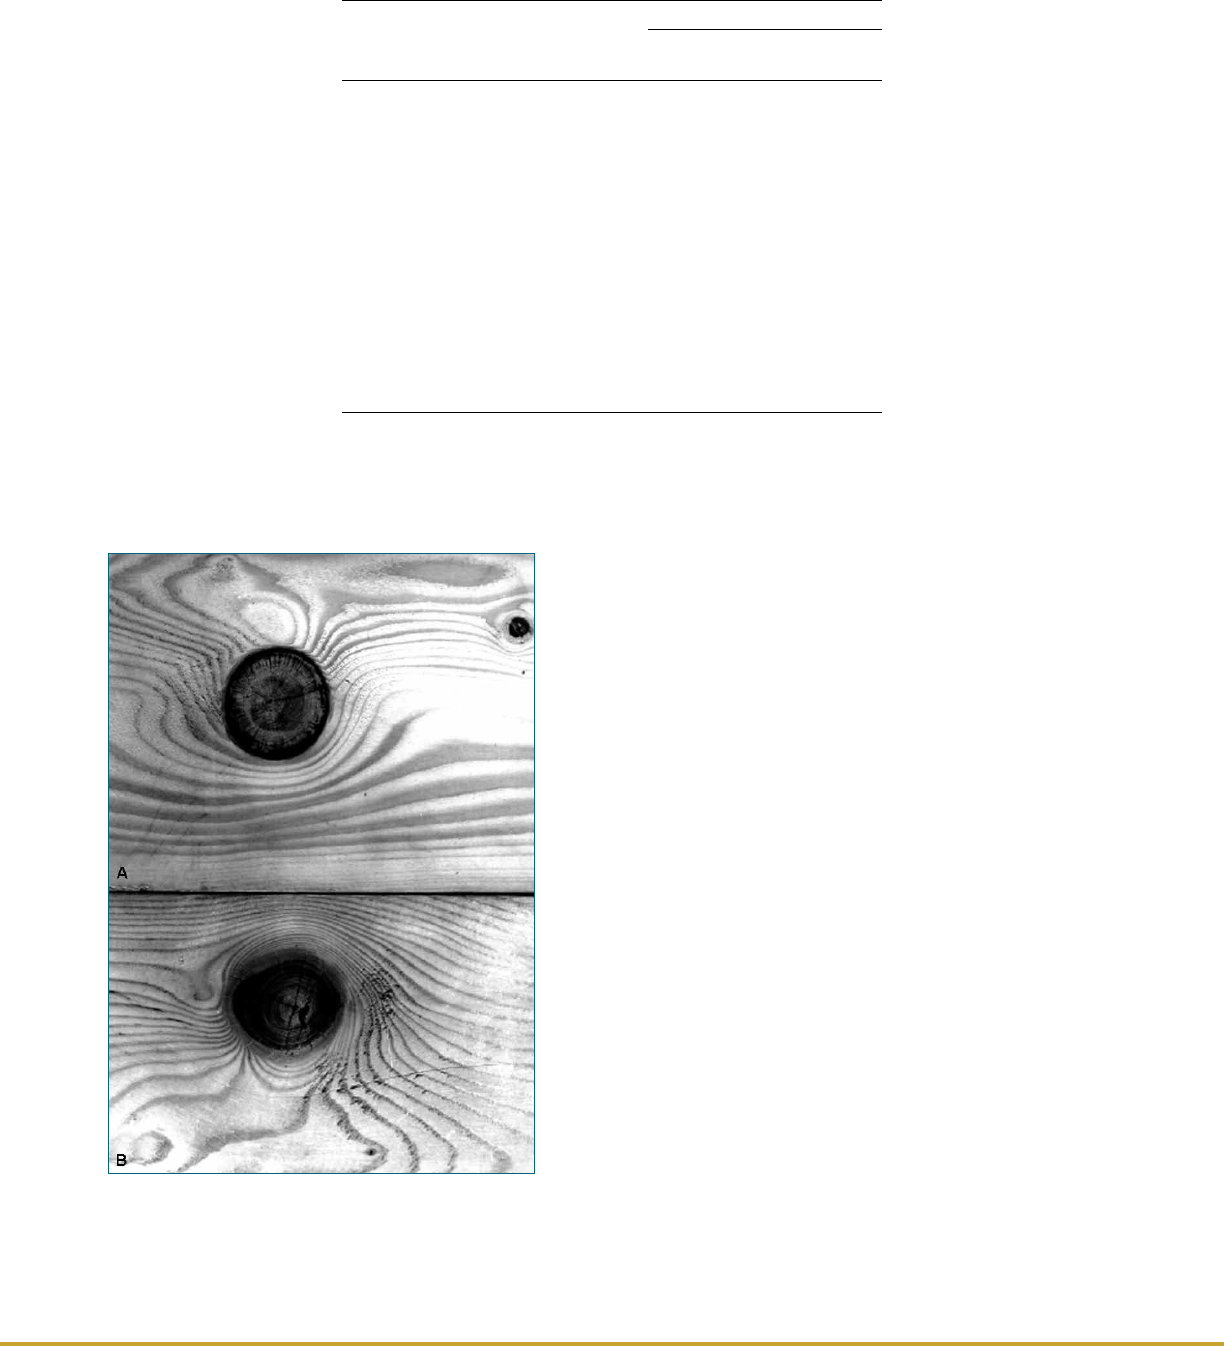
associated with the knot. The inuence of knots depends on
their size, location, shape, and soundness; attendant local
slope of grain; and type of stress to which the wood member
is subjected.
The shape (form) of a knot on a sawn surface depends upon
the direction of the exposing cut. A nearly round knot is pro-
duced when lumber is sawn from a log and a branch is sawn
through at right angles to its length (as in a atsawn board).
An oval knot is produced if the saw cut is diagonal to the
branch length (as in a bastard-sawn board) and a “spiked”
knot when the cut is lengthwise to the branch (as in a quar-
tersawn board).
Knots are further classied as intergrown or encased
(Fig. 5–3). As long as a limb remains alive, there is continu-
ous growth at the junction of the limb and the bole of the
tree, and the resulting knot is called intergrown. After the
branch has died, additional growth on the trunk encloses
the dead limb, resulting in an encased knot; bole bers are
not continuous with the bers of the encased knot. Encased
knots and knotholes tend to be accompanied by less cross-
grain than are intergrown knots and are therefore generally
less problematic with regard to most mechanical properties.
Most mechanical properties are lower in sections containing
knots than in clear straight-grained wood because (a) the
clear wood is displaced by the knot, (b) the bers around the
knot are distorted, resulting in cross grain, (c) the disconti-
nuity of wood ber leads to stress concentrations, and (d)
checking often occurs around the knots during drying. Hard-
ness and strength in compression perpendicular to the grain
Table 5–8. Average toughness values for a few hardwood
species
a
Toughness
b
Species
Moisture
content
Specific
gravity
c
Radial
(J (in-lbf))
Tangential
(J (in-lbf))
Birch, yellow 12% 0.65 8,100 (500) 10,100 (620)
Hickory (mocker- Green 0.64 11,400 (700) 11,700 (720)
nut, pignut, sand) 12% 0.71 10,100 (620) 10,700 (660)
Maple, sugar 14% 0.64 6,000 (370) 5,900 (360)
Oak, red
Pin 12% 0.64 7,000 (430) 7,000 (430)
Scarlet 11% 0.66 8,300 (510) 7,200 (440)
Oak, white
Overcup Green 0.56 11,900 (730) 11,100 (680)
13% 0.62 5,500 (340) 5,000 (310)
Sweetgum Green 0.48 5,500 (340) 5,400 (330)
13% 0.51 4,200 (260) 4,200 (260)
Willow, black Green 0.38 5,000 (310) 5,900 (360)
11% 0.4 3,400 (210) 3,700 (230)
Yellow-poplar Green 0.43 5,200 (320) 4,900 (300)
12% 0.45 3,600 (220) 3,400 (210)
a
Results of tests on clear, straight-grained specimens.
b
Properties based on specimen size of 2 cm square by 28 cm long; radial indicates
load applied to radial face and tangential indicates load applied to tangential face of
specimens.
c
Based on ovendry weight and volume at moisture content of test.
Figure 5–3. Types of knots. A, encased knot; B,
intergrown knot.
Chapter 5 Mechanical Properties of Wood
5–27

are exceptions, where knots may be objectionable only in
that they cause nonuniform wear or nonuniform stress distri-
butions at contact surfaces.
Knots have a much greater effect on strength in axial tension
than in axial short-column compression, and the effects on
bending are somewhat less than those in axial tension. For
this reason, in a simply supported beam, a knot on the lower
side (subjected to tensile stresses) has a greater effect on the
load the beam will support than does a knot on the upper
side (subjected to compressive stresses).
In long columns, knots are important because they affect
stiffness. In short or intermediate columns, the reduction in
strength caused by knots is approximately proportional to
their size; however, large knots have a somewhat greater
relative effect than do small knots.
Knots in round timbers, such as poles and piles, have less
effect on strength than do knots in sawn timbers. Although
the grain is irregular around knots in both forms of timber,
the angle of the grain to the surface is smaller in naturally
round timber than in sawn timber. Furthermore, in round
timbers there is no discontinuity in wood bers, which re-
sults from sawing through both local and general slope of
grain.
The effects of knots in structural lumber are discussed in
Chapter 7.
Slope of Grain
In some wood product applications, the directions of im-
portant stresses may not coincide with the natural axes of
ber orientation in the wood. This may occur by choice in
Table 5–9. Average toughness values for a few softwood
species
a
Toughness
b
Species
Moisture
content
Specific
gravity
c
Radial
(J (in-lbf))
Tangential
(J (in-lbf))
Cedar
Western red 9% 0.33 1,500 (90) 2,100 (130)
Yellow 10% 0.48 3,400 (210) 3,700 (230)
Douglas-fir
Coast Green 0.44 3,400 (210) 5,900 (360)
12% 0.47 3,300 (200) 5,900 (360)
Interior west Green 0.48 3,300 (200) 4,900 (300)
13% 0.51 3,400 (210) 5,500 (340)
Interior north Green 0.43 2,800 (170) 3,900 (240)
14% 0.46 2,600 (160) 4,100 (250)
Interior south Green 0.38 2,100 (130) 2,900 (180)
14% 0.4 2,000 (120) 2,900 (180)
Fir
California red Green 0.36 2,100 (130) 2,900 (180)
12% 0.39 2,000 (120) 2,800 (170)
Noble Green 0.36 — — 3,900 (240)
12% 0.39 — — 3,600 (220)
Pacific silver Green 0.37 2,400 (150) 3,700 (230)
13% 0.4 2,800 (170) 4,200 (260)
White Green 0.36 2,300 (140) 3,600 (220)
13% 0.38 2,100 (130) 3,300 (200)
Hemlock
Mountain Green 0.41 4,100 (250) 4,600 (280)
14% 0.44 2,300 (140) 2,800 (170)
Western Green 0.38 2,400 (150) 2,800 (170)
12% 0.41 2,300 (140) 3,400 (210)
Larch, western Green 0.51 4,400 (270) 6,500 (400)
12% 0.55 3,400 (210) 5,500 (340)
Pine
Eastern white Green 0.33 2,000 (120) 2,600 (160)
12% 0.34 1,800 (110) 2,000 (120)
Jack Green 0.41 3,300 (200) 6,200 (380)
12% 0.42 2,300 (140) 3,900 (240)
Loblolly Green 0.48 5,000 (310) 6,200 (380)
12% 0.51 2,600 (160) 4,200 (260)
Lodgepole Green 0.38 2,600 (160) 3,400 (210)
Ponderosa Green 0.38 3,100 (190) 4,400 (270)
11% 0.43 2,400 (150) 3,100 (190)
Red Green 0.4 3,400 (210) 5,700 (350)
12% 0.43 2,600 (160) 4,700 (290)
Shortleaf Green 0.47 4,700 (290) 6,500 (400)
13% 0.5 2,400 (150) 3,700 (230)
Slash Green 0.55 5,700 (350) 7,300 (450)
12% 0.59 3,400 (210) 5,200 (320)
Virginia Green 0.45 5,500 (340) 7,600 (470)
12% 0.49 2,800 (170) 4,100 (250)
Redwood
Old-growth Green 0.39 1,800 (110) 3,300 (200)
11% 0.39 1,500 (90) 2,300 (140)
Young-growth Green 0.33 1,800 (110) 2,300 (140)
12% 0.34 1,500 (90) 1,800 (110)
Spruce, Green 0.34 2,400 (150) 3,100 (190)
Engelmann 12% 0.35 1,800 (110) 2,900 (180)
a
Results of tests on clear, straight-grained specimens.
b
Properties based on specimen size of 2 cm square by 28 cm long; radial
indicates load applied to radial face and tangential indicates load applied to
tangential face of specimens.
c
Based on ovendry weight and volume at moisture content of test.
Table 5–10. Summary of selected fracture
toughness results
Fracture toughness
(kPa m
1/2
(lbf in
–2
in
1/2
))
Mode I Mode II
Species TL RL TL RL
Douglas-fir 320 (290) 360
(330)
2,230
(2,030)
Western hemlock 375 (340) 2,240
(2,040)
Pine
Western white 250 (225) 260
(240)
Scots 440 (400) 500
(455)
2,050
(1,860)
Southern 375 (340) 2,070
(1,880)
Ponderosa 290 (265)
Red spruce 420 (380) 2,190
(1,990)
1,665
(1,510)
N
orthern red oa
k
410 (370)
Sugar maple 480 (430)
Yellow-poplar 517 (470)
5–28
General Technical Report FPL–GTR–190
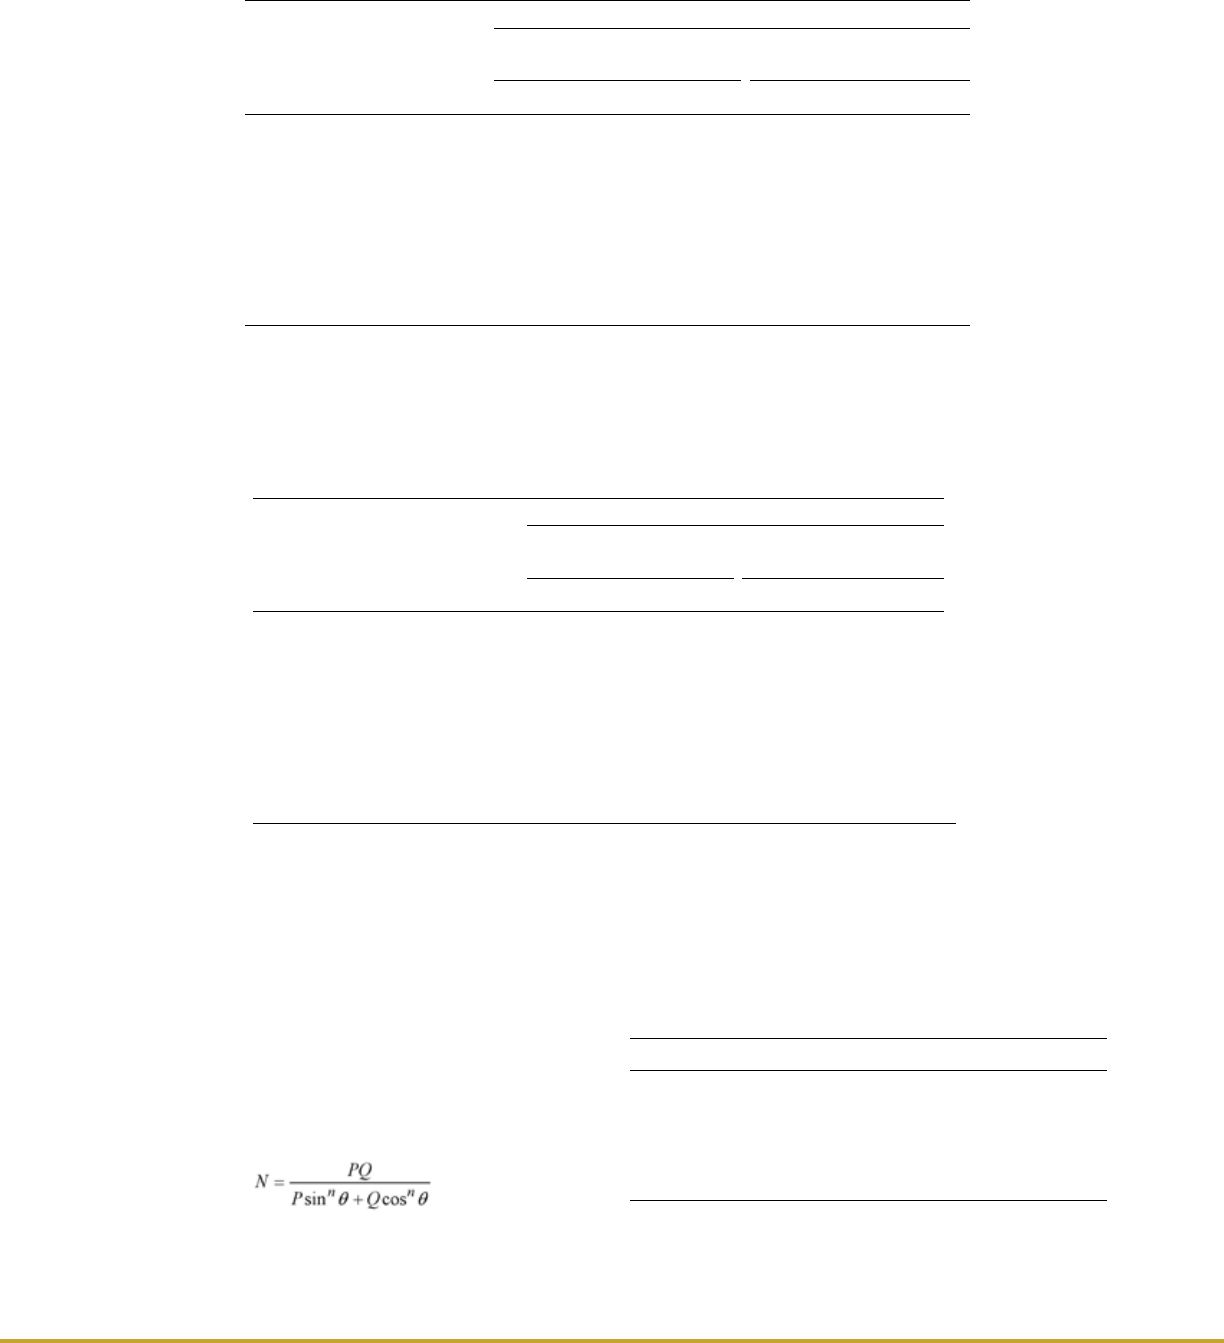
design, from the way the wood was removed from the log,
or because of grain irregularities that occurred while the tree
was growing.
Elastic properties in directions other than along the natural
axes can be obtained from elastic theory. Strength properties
in directions ranging from parallel to perpendicular to the
bers can be approximated using a Hankinson-type formula
(Bodig and Jayne 1982):
(5–2)
where N is strength at angle q from ber direction, Q
strength perpendicular to grain, P strength parallel to grain,
and n an empirically determined constant.
This formula has been used for modulus of elasticity as well
as strength properties. Values of n and associated ratios of
Q/P tabulated from available literature are as follows:
Property
n Q/P
Tensile strength 1.5–2 0.04–0.07
Compression strength 2–2.5 0.03–0.40
Bending strength 1.5–2 0.04–0.10
Modulus of elasticity 2 0.04–0.12
Toughness 1.5–2 0.06–0.10
The Hankinson-type formula can be graphically depicted as
a function of Q/P and n. Figure 5–4 shows the strength in
any direction expressed as a fraction of the strength parallel
Table 5–11a. Functions relating mechanical properties to specific gravity of clear,
straight-grained wood (metric)
Specific gravity–strength relationship
Green wood
Wood at 12%
moisture content
Property
a
Softwoods Hardwoods Softwoods Hardwoods
Static bending
MOR (kPa) 109,600 G
1.01
118,700 G
1.16
170,700 G
1.01
171,300 G
1.13
MOE (MPa) 16,100 G
0.76
13,900 G
0.72
20,500 G
0.84
16,500 G
0.7
WML (kJ m
–3
) 147 G
1.21
229 G
1.51
179 G
1.34
219 G
1.54
Impact bending (N) 353 G
1.35
422 G
1.39
346 G
1.39
423 G
1.65
Compression parallel (kPa) 49,700 G
0.94
49,000 G
1.11
93,700 G
0.97
76,000 G
0.89
Compression perpendicular (kPa) 8,800 G
1.53
18,500 G
2.48
16,500 G
1.57
21,600 G
2.09
Shear parallel (kPa) 11,000 G
0.73
17,800 G
1.24
16,600 G
0.85
21,900 G
1.13
Tension perpendicular (kPa) 3,800 G
0.78
10,500 G
1.37
6,000 G
1.11
10,100 G
1.3
Side hardness (N) 6,230 G
1.41
16,550 G
2.31
8,590 G
1.49
15,300 G
2.09
a
Compression parallel to grain is maximum crushing strength;
compression perpendicular to grain is fiber stress
at proportional limit. MOR is modulus of rupture; MOE, modulus of elasticity; and WML, work to maximum
load. For green wood, use specific gravity based on ovendry weight and green volume; for dry wood, use
specific gravity based on ovendry weight and volume at 12% moisture content. Calculated using all data from
Table 5–3.
Table 5–11b. Functions relating mechanical properties to specific gravity of
clear, straight-grained wood (inch–pound)
Specific gravity–strength relationship
Green wood
Wood at 12%
moisture content
Property
a
Softwoods Hardwoods Softwoods Hardwoods
Static bending
MOR (lb in
–2
) 15,890 G
1.01
17,210 G
1.16
24,760 G
1.01
24,850 G
1.13
MOE (10
6
lb in
–2
)
2.33 G
0.76
2.02 G
0.72
2.97 G
.0.84
2.39 G
0.7
WML (in-lbf in
–3
) 21.33 G
1.21
33.2 G
1.51
25.9 G
1.34
31.8 G
1.54
Impact bending (lbf) 79.28 G
1.35
94.8 G
1.39
77.7 G
1.39
95.1 G
1.65
Compression parallel (lb in
–2
) 7,210 G
0.94
7,110 G
1.11
13,590 G
0.97
11,030 G
0.89
Compression perpendicular (lb in
–2
) 1,270 G
1.53
2,680 G
2.48
2,390 G
1.57
3,130 G
2.09
Shear parallel (lb in
–2
) 1,590 G
0.73
2,580 G
1.24
2,410 G
.0.85
3,170 G
1.13
Tension perpendicular (lb in
–2
) 550 G
0.78
1,520 G
1.37
870 G
1.11
1,460 G
1.3
Side hardness (lbf) 1,400 G
1.41
3,720 G
2.31
1,930 G
1.49
3,440 G
2.09
a
Compression parallel to grain is maximum crushing strength; compression perpendicular to grain is fiber
stress at proportional limit. MOR is modulus of rupture; MOE, modulus of elasticity; and WML, work to
maximum load. For green wood, use specific gravity based on ovendry weight and green volume; for dry
wood, use specific gravity based on ovendry weight and volume at 12% moisture content. Calculated
using all data from Table 5–3.
Chapter 5 Mechanical Properties of Wood
5–29
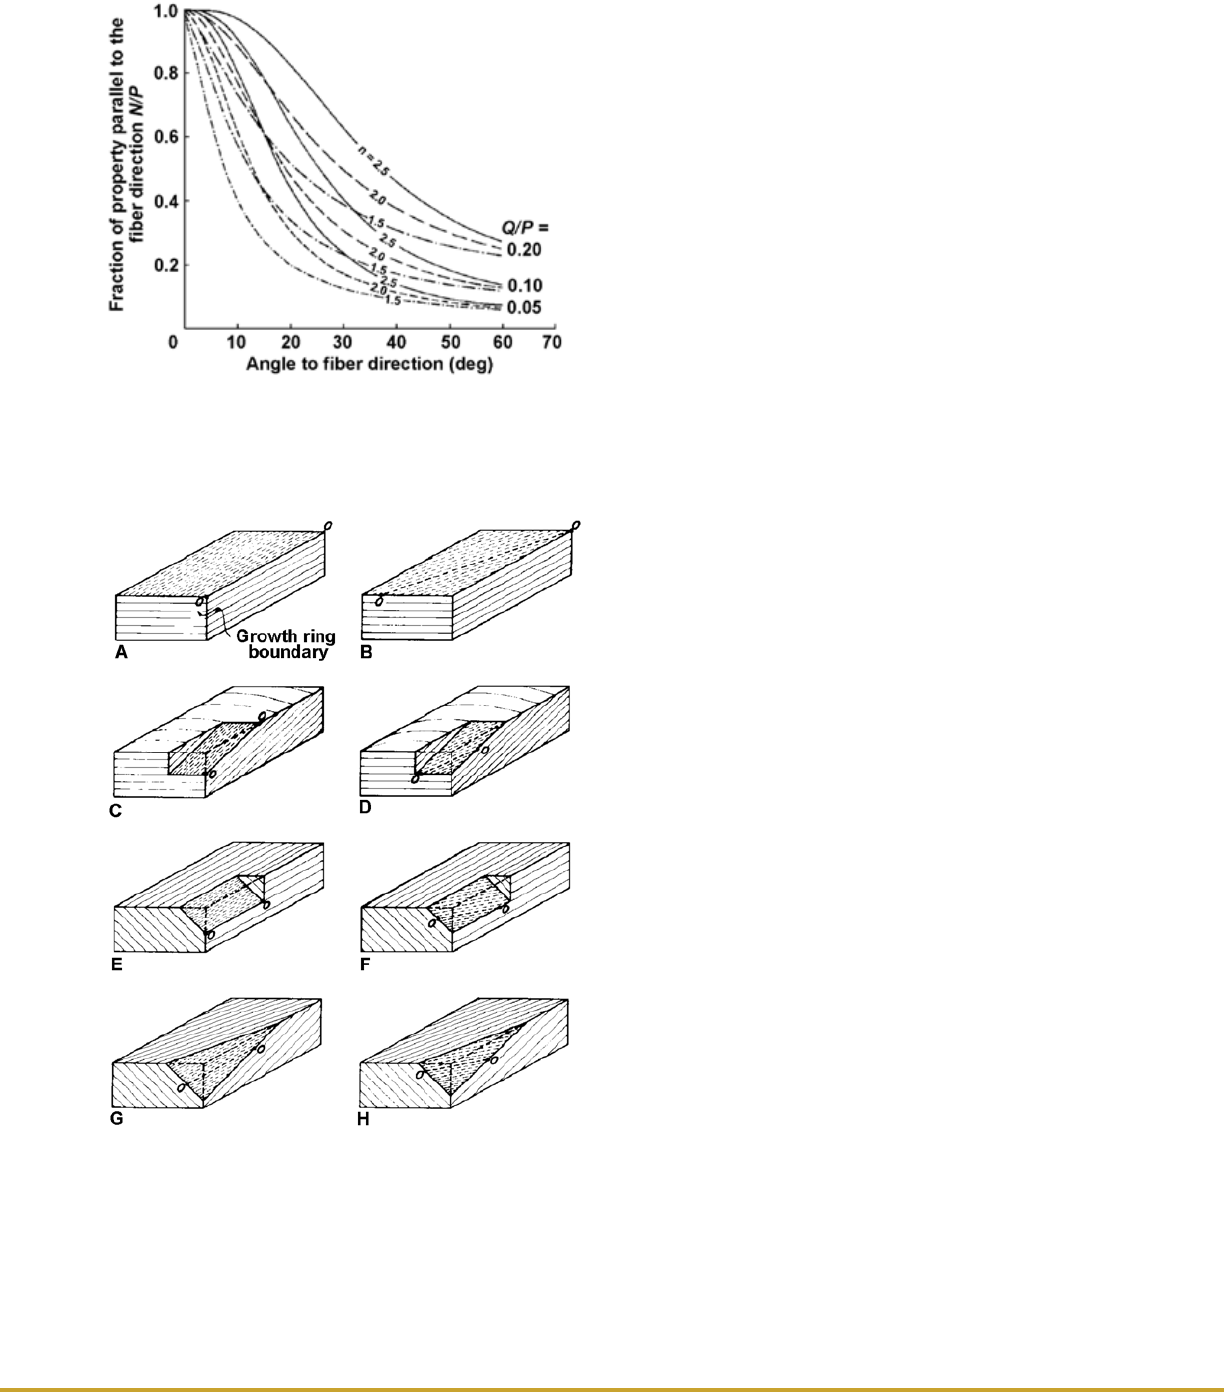
to ber direction, plotted against angle to the ber direction
q. The plot is for a range of values of Q/P and n.
The term slope of grain relates the ber direction to the
edges of a piece. Slope of grain is usually expressed by the
ratio between 25 mm (1 in.) of the grain from the edge or
long axis of the piece and the distance in millimeters (inch-
es) within which this deviation occurs (tan q). The effect of
grain slope on some properties of wood, as determined
from tests, is shown in Table 5–12. The values for modulus
of rupture fall very close to the curve in Figure 5–4 for
Q/P = 0.1 and n = 1.5. Similarly, the impact bending values
fall close to the curve for Q/P = 0.05 and n =1.5, and the
compression values for the curve for Q/P = 0.1, n = 2.5.
The term cross grain indicates the condition measured by
slope of grain. Two important forms of cross grain are spiral
and diagonal (Fig. 5–5). Other types are wavy, dipped, inter-
locked, and curly.
Spiral grain is caused by winding or spiral growth of wood
bers about the bole of the tree instead of vertical growth.
In sawn products, spiral grain can be dened as bers lying
in the tangential plane of the growth rings, rather than paral-
lel to the longitudinal axis of the product (see Fig. 5–5 for a
simple case). Spiral grain in sawn products often goes unde-
tected by ordinary visual inspection. The best test for spiral
grain is to split a sample section from the piece in the radial
direction. A visual method of determining the presence
of spiral grain is to note the alignment of pores, rays, and
resin ducts on a atsawn face. Drying checks on a atsawn
surface follow the bers and indicate the slope of the ber.
Relative change in electrical capacitance is an effective
technique for measuring slope of grain.
Diagonal grain is cross grain caused by growth rings that are
not parallel to one or both surfaces of the sawn piece. Di-
agonal grain is produced by sawing a log with pronounced
taper parallel to the axis (pith) of the tree. Diagonal grain
also occurs in lumber sawn from crooked logs or logs with
butt swell.
Cross grain can be quite localized as a result of the dis-
turbance of a growth pattern by a branch. This condition,
termed local slope of grain, may be present even though the
branch (knot) may have been removed by sawing. The de-
gree of local cross grain may often be difcult to determine.
Any form of cross grain can have a deleterious effect on me-
chanical properties or machining characteristics.
Spiral and diagonal grain can combine to produce a more
complex cross grain. To determine net cross grain, regard-
less of origin, ber slopes on the contiguous surface of a
piece must be measured and combined. The combined slope
of grain is determined by taking the square root of the sum
of the squares of the two slopes. For example, assume
Figure 5–4. Effect of grain angle on mechanical proper-
ty of clear wood according to Hankinson-type formula.
Q/P is ratio of mechanical property across the grain (Q)
to that parallel to the grain (P); n is an empirically de-
termined constant.
Figure 5–5. Relationship of ber orientation (O–O)
to axes, as shown by schematic of wood specimens
containing straight grain and cross grain. Specimens
A through D have radial and tangential surfaces; E
through H do not. Specimens A and E contain no cross
grain; B, D, F, and H have spiral grain; C, D, G, and H
have diagonal grain.
5–30
General Technical Report FPL–GTR–190
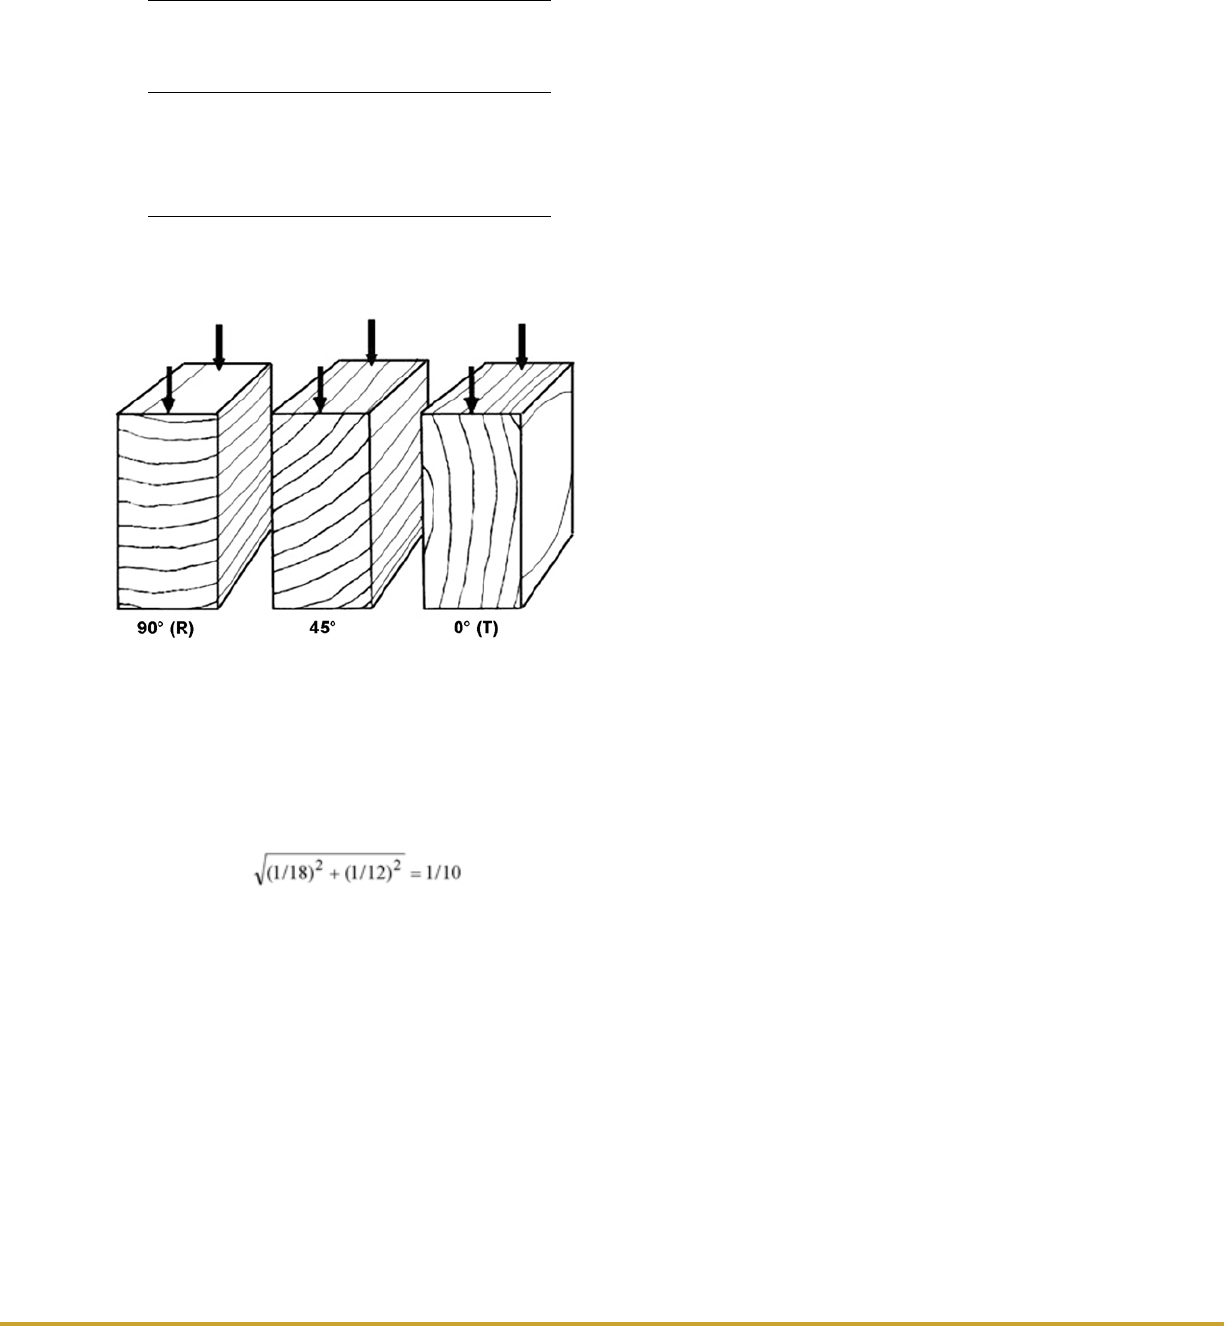
that the spiral grain slope on the at-grained surface of
Figure 5–5D is 1 in 12 and the diagonal-grain slope is 1 in
18. The combined slope is
or a slope of 1 in 10.
A regular reversal of right and left spiraling of grain in a tree
stem produces the condition known as interlocked grain.
Interlocked grain occurs in some hardwood species and
markedly increases resistance to splitting in the radial plane.
Interlocked grain decreases both the static bending strength
and stiffness of clear wood specimens. The data from tests
of domestic hardwoods shown in Table 5–3 do not include
pieces that exhibited interlocked grain. Some mechanical
property values in Table 5–5 are based on specimens with
interlocked grain because that is a characteristic of some
species. The presence of interlocked grain alters the rela-
tionship between bending strength and compressive strength
of lumber cut from tropical hardwoods.
Annual Ring Orientation
Stresses perpendicular to the ber (grain) direction may be
at any angle from 0° (T direction) to 90° (R direction) to
the growth rings (Fig. 5–6). Perpendicular-to-grain proper-
ties depend somewhat upon orientation of annual rings with
respect to the direction of stress. The compression perpen-
dicular-to-grain values in Table 5–3 were derived from tests
in which the load was applied parallel to the growth rings (T
direction); shear parallel-to-grain and tension perpendicular-
to-grain values are averages of equal numbers of specimens
with 0° and 90° growth ring orientations. In some species,
there is no difference in 0° and 90° orientation properties.
Other species exhibit slightly higher shear parallel or ten-
sion perpendicular-to-grain properties for the 0° orientation
than for the 90° orientation; the converse is true for about an
equal number of species.
The effects of intermediate annual ring orientations have
been studied in a limited way. Modulus of elasticity, com-
pressive perpendicular-to-grain stress at the proportional
limit, and tensile strength perpendicular to the grain tend to
be about the same at 45° and 0°, but for some species these
values are 40% to 60% lower at the 45° orientation. For
those species with lower properties at 45° ring orientation,
properties tend to be about equal at 0° and 90° orientations.
For species with about equal properties at 0° and 45° orien-
tations, properties tend to be higher at the 90° orientation.
Reaction Wood
Abnormal woody tissue is frequently associated with lean-
ing boles and crooked limbs of both conifers and hard-
woods. Such wood is generally believed to be formed as
a natural response of the tree to return its limbs or bole to
a more normal position, hence the term reaction wood. In
softwoods, the abnormal tissue is called compression wood;
it is common to all softwood species and is found on the
lower side of the limb or inclined bole. In hardwoods, the
abnormal tissue is known as tension wood; it is located on
the upper side of the inclined member, although in some
instances it is distributed irregularly around the cross sec-
tion. Reaction wood is more prevalent in some species than
in others.
Many of the anatomical, chemical, physical, and mechanical
properties of reaction wood differ distinctly from those of
normal wood. Perhaps most evident is the increase in densi-
ty compared with that of normal wood. The specic gravity
of compression wood is commonly 30% to 40% greater than
that of normal wood; the specic gravity of tension wood
commonly ranges between 5% and 10% greater than that of
normal wood, but it may be as much as 30% greater.
Compression wood is usually somewhat darker than normal
wood because of the greater proportion of latewood, and it
frequently has a relatively lifeless appearance, especially in
woods in which the transition from earlywood to latewood
is abrupt. Because compression wood is more opaque than
Table 5–12. Strength of wood members with
various grain slopes compared with strength
of a straight-grained member
a
Maximum slope
of grain in
member
Modulus
of
rupture
(%)
Impact
bending
(%)
Compression
parallel to
grain
(%)
Straight-grained 100 100 100
1 in 25 96 95 100
1 in 20 93 90 100
1 in 15 89 81 100
1 in 10 81 62 99
1 in 5 55 36 93
a
Impact bending is height of drop causing complete failure
(22.7-kg (50-lb) hammer); compression parallel to grain is
maximum crushing strength.
Figure 5–6. Direction of load in relation to direction of
annual growth rings: 90° or perpendicular (R), 45°, 0° or
parallel (T).
Chapter 5 Mechanical Properties of Wood
5–31
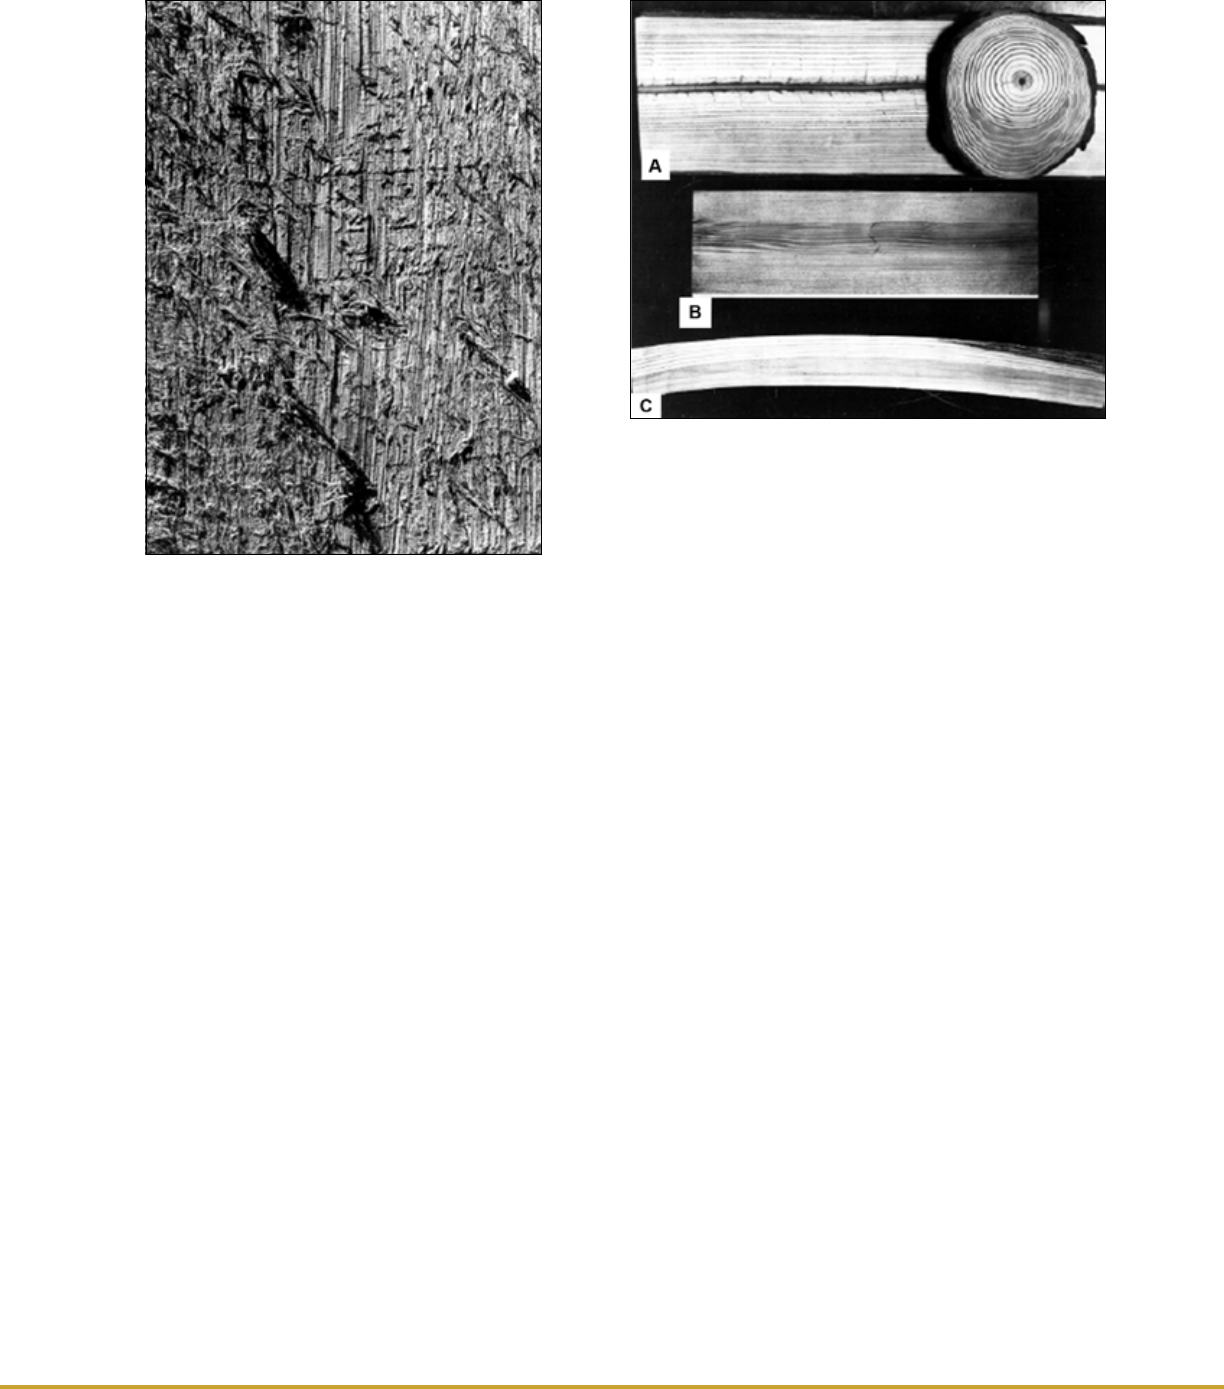
normal wood, intermediate stages of compression wood can
be detected by transmitting light through thin cross sections;
however, borderline forms of compression wood that merge
with normal wood can commonly be detected only by mi-
croscopic examination.
Tension wood is more difcult to detect than is compression
wood. However, eccentric growth as seen on the transverse
section suggests its presence. Also, because it is difcult to
cleanly cut the tough tension wood bers, the surfaces of
sawn boards are “woolly,” especially when the boards are
sawn in the green condition (Fig. 5–7). In some species, ten-
sion wood may be evident on a smooth surface as areas of
contrasting colors. Examples of this are the silvery appear-
ance of tension wood in sugar maple and the darker color
of tension wood in mahogany.
Reaction wood, particularly compression wood in the green
condition, may be stronger than normal wood. However,
compared with normal wood with similar specic gravity,
reaction wood is denitely weaker. Possible exceptions to
this are compression parallel-to-grain properties of compres-
sion wood and impact bending properties of tension wood.
Because of the abnormal properties of reaction wood, it
may be desirable to eliminate this wood from raw material.
In logs, compression wood is characterized by eccentric
growth about the pith and the large proportion of latewood
at the point of greatest eccentricity (Fig. 5–8A). Fortunately,
pronounced compression wood in lumber can generally be
detected by ordinary visual examination.
Compression and tension wood undergo extensive longitu-
dinal shrinkage when subjected to moisture loss below the
ber saturation point. Longitudinal shrinkage in compres-
sion wood may be up to 10 times that in normal wood, and
in tension wood, perhaps up to 5 times that in normal wood.
When reaction wood and normal wood are present in the
same board, unequal longitudinal shrinkage causes internal
stresses that result in warping. In extreme cases, unequal
longitudinal shrinkage results in axial tension failure over a
portion of the cross section of the lumber (Fig. 5–8B). Warp
sometimes occurs in rough lumber but more often in planed,
ripped, or resawn lumber (Fig. 5–8C).
Juvenile Wood
Juvenile wood is the wood produced near the pith of the
tree; for softwoods, it is usually dened as the material 5 to
20 rings from the pith depending on species. Juvenile wood
has considerably different physical and anatomical proper-
ties than that of mature wood (Fig. 5–9). In clear wood, the
properties that have been found to inuence mechanical
behavior include bril angle, cell length, and specic grav-
ity, the latter a composite of percentage of latewood, cell
wall thickness, and lumen diameter. Juvenile wood has a
high bril angle (angle between longitudinal axis of wood
cell and cellulose brils), which causes longitudinal shrink-
age that may be more than 10 times that of mature wood.
Compression wood and spiral grain are also more prevalent
in juvenile wood than in mature wood and contribute to
longitudinal shrinkage. In structural lumber, the ratio of
modulus of rupture, ultimate tensile stress, and modulus
of elasticity for juvenile to mature wood ranges from 0.5
Figure 5–7. Projecting tension wood bers on
sawn surface of mahogany board.
Figure 5–8. Effects of compression wood. A, eccentric
growth about pith in cross section containing compres-
sion wood—dark area in lower third of cross section is
compression wood; B, axial tension break caused by ex-
cessive longitudinal shrinkage of compression wood;
C, warp caused by excessive longitudinal shrinkage.
5–32
General Technical Report FPL–GTR–190
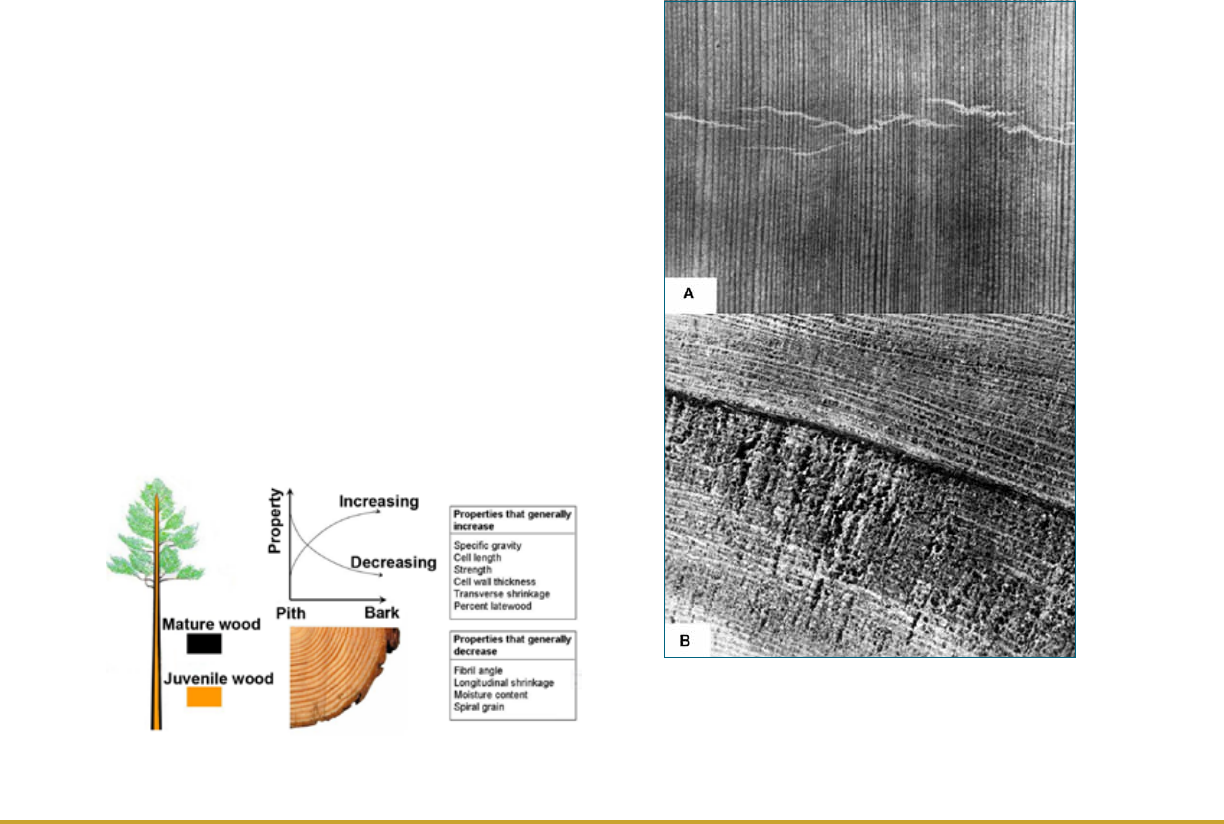
to 0.9, 0.5 to 0.95, and 0.45 to 0.75, respectively. Changes
in shear strength resulting from increases in juvenile wood
content can be adequately predicted by monitoring changes
in density alone for all annual ring orientations. The same is
true for perpendicular-to-grain compressive strength when
the load is applied in the tangential direction. Compressive
strength perpendicular-to-grain for loads applied in the ra-
dial direction, however, is more sensitive to changes in ju-
venile wood content and may be up to eight times less than
that suggested by changes in density alone (Kretschmann
2008). The juvenile wood to mature wood ratio is lower for
higher grades of lumber than for lower grades, which indi-
cates that juvenile wood has greater inuence in reducing
the mechanical properties of high-grade structural lumber.
Only a limited amount of research has been done on juve-
nile wood in hardwood species.
Compression Failures
Excessive compressive stresses along the grain that produce
minute compression failures can be caused by excessive
bending of standing trees from wind or snow; felling of
trees across boulders, logs, or irregularities in the ground;
or rough handling of logs or lumber. Compression failures
should not be confused with compression wood. In some
instances, compression failures are visible on the surface
of a board as minute lines or zones formed by crumpling or
buckling of cells (Fig. 5–10A), although the failures usu-
ally appear as white lines or may even be invisible to the
unaided eye. The presence of compression failures may be
indicated by ber breakage on end grain (Fig. 5–10B). Be-
cause compression failures are often difcult to detect with
the unaided eye, special efforts, including optimum lighting,
may be required for detection. The most difcult cases are
detected only by microscopic examination.
Products containing visible compression failures have low
strength properties, especially in tensile strength and shock
resistance. The tensile strength of wood containing com-
pression failures may be as low as one-third the strength of
matched clear wood. Even slight compression failures, vis-
ible only under a microscope, may seriously reduce strength
and cause brittle fracture. Because of the low strength
associated with compression failures, many safety codes
require certain structural members, such as ladder rails and
scaffold planks, to be entirely free of such failures.
Pitch Pockets
A pitch pocket is a well-dened opening that contains free
resin. The pocket extends parallel to the annual rings; it
is almost at on the pith side and curved on the bark side.
Pitch pockets are conned to such species as the pines,
spruces, Douglas-r, tamarack, and western larch.
The effect of pitch pockets on strength depends upon their
number, size, and location in the piece. A large number
of pitch pockets indicates a lack of bond between annual
growth layers, and a piece with pitch pockets should be in-
spected for shake or separation along the grain.
Bird Peck
Maple, hickory, white ash, and a number of other species are
often damaged by small holes made by woodpeckers. These
bird pecks often occur in horizontal rows, sometimes encir-
cling the tree, and a brown or black discoloration known as
a mineral streak originates from each hole. Holes for tapping
Figure 5–9. Properties of juvenile wood.
Figure 5–10. Compression failures. A, compres-
sion failure shown by irregular lines across grain;
B, ber breakage in end-grain surfaces of spruce
lumber caused by compression failures below dark
line.
Chapter 5 Mechanical Properties of Wood
5–33
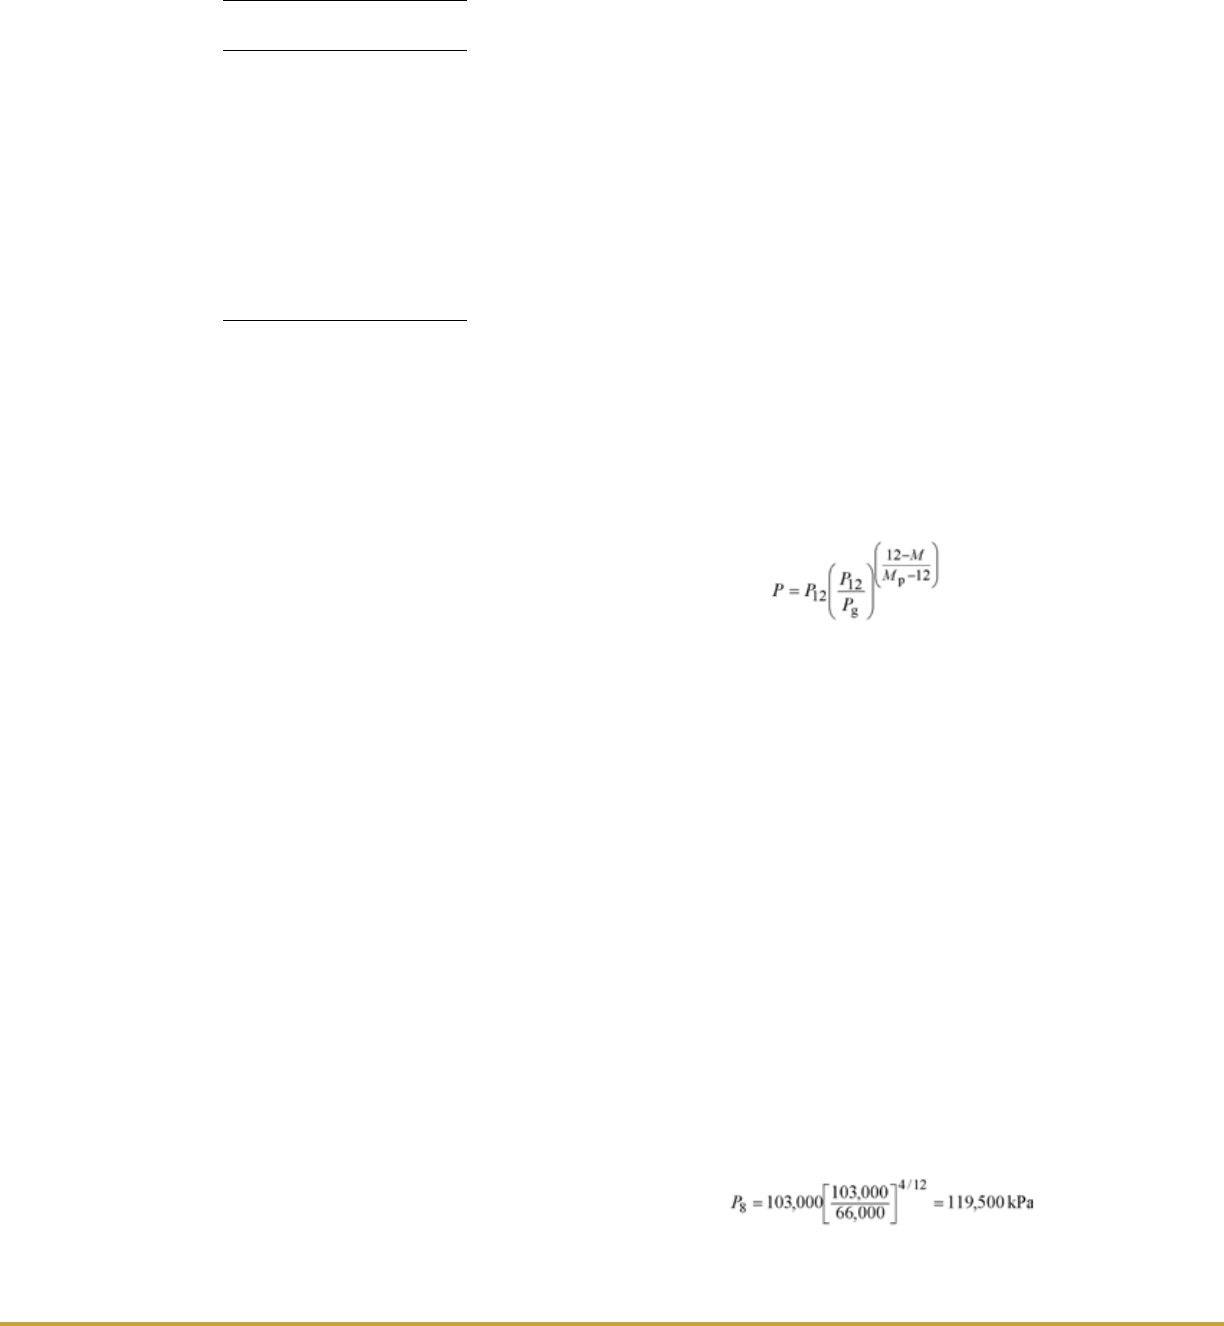
maple trees are also a source of mineral streaks. The streaks
are caused by oxidation and other chemical changes in the
wood. Bird pecks and mineral streaks are not generally im-
portant in regard to strength of structural lumber, although
they do impair the appearance of the wood.
Extractives
Many wood species contain removable extraneous materials
or extractives that do not degrade the cellulose–lignin struc-
ture of the wood. These extractives are especially abundant
in species such as larch, redwood, western redcedar, and
black locust.
A small decrease in modulus of rupture and strength in
compression parallel to grain has been measured for some
species after the extractives have been removed. The extent
to which extractives inuence strength is apparently a func-
tion of the amount of extractives, the moisture content of the
piece, and the mechanical property under consideration.
Properties of Timber from Dead Trees
Timber from trees killed by insects, blight, wind, or re may
be as good for any structural purpose as that from live trees,
provided further insect attack, staining, decay, or drying
degrade has not occurred. In a living tree, the heartwood is
entirely dead and only a comparatively few sapwood cells
are alive. Therefore, most wood is dead when cut, regardless
of whether the tree itself is living or not. However, if a tree
stands on the stump too long after its death, the sapwood is
likely to decay or to be attacked severely by wood-boring
insects, and eventually the heartwood will be similarly af-
fected. Such deterioration also occurs in logs that have been
cut from live trees and improperly cared for afterwards. Be-
cause of variations in climatic and other factors that affect
deterioration, the time that dead timber may stand or lie in
the forest without serious deterioration varies.
Tests on wood from trees that had stood as long as 15 years
after being killed by re demonstrated that this wood was as
sound and strong as wood from live trees. Also, the heart-
wood of logs of some more durable species has been found
to be thoroughly sound after lying in the forest for many
years.
On the other hand, in nonresistant species, decay may cause
great loss of strength within a very brief time, both in trees
standing dead on the stump and in logs cut from live trees
and allowed to lie on the ground. The important consider-
ation is not whether the trees from which wood products are
cut are alive or dead, but whether the products themselves
are free from decay or other degrading factors that would
render them unsuitable for use.
Effects of Manufacturing and Service
Environments
Moisture Content
Many mechanical properties are affected by changes in
moisture content below the ber saturation point. Most
properties reported in Tables 5–3 to 5–5 increase with de-
crease in moisture content. The relationship that describes
these changes in clear wood property at about 21 °C (70 °F)
is
(5–3)
where P is the property at moisture content M (%), P
12
the
same property at 12% MC, P
g
the same property for green
wood, and M
p
moisture content at the intersection of a
horizontal line representing the strength of green wood and
an inclined line representing the logarithm of the strength–
moisture content relationship for dry wood. This assumed
linear relationship results in an M
p
value that is slightly less
than the ber saturation point. Table 5–13 gives values of
M
p
for a few species; for other species, M
p
= 25 may be
assumed.
Average property values of P
12
and P
g
are given for many
species in Tables 5–3 to 5–5. The formula for moisture con-
tent adjustment is not recommended for work to maximum
load, impact bending, and tension perpendicular to grain.
These properties are known to be erratic in their response
to moisture content change.
The formula can be used to estimate a property at any mois-
ture content below M
p
from the species data given. For ex-
ample, suppose you want to nd the modulus of rupture of
white ash at 8% moisture content. Using information from
Tables 5–3a and 5–13,
Care should be exercised when adjusting properties below
12% moisture. Although most properties will continue to
Table 5–13. Intersection
moisture content values for
selected species
a
Species
M
p
(%)
Ash, white 24
Birch, yellow 27
Chestnut, American 24
Douglas-fir 24
Hemlock, western 28
Larch, western 28
Pine, loblolly 21
Pine, longleaf 21
Pine, red 24
Redwood 21
Spruce, red 27
Spruce, Sitka 27
Tamarack 24
a
Intersection moisture content is point
at which mechanical properties begin
to change when wood is dried from
the green condition.
5–34
General Technical Report FPL–GTR–190
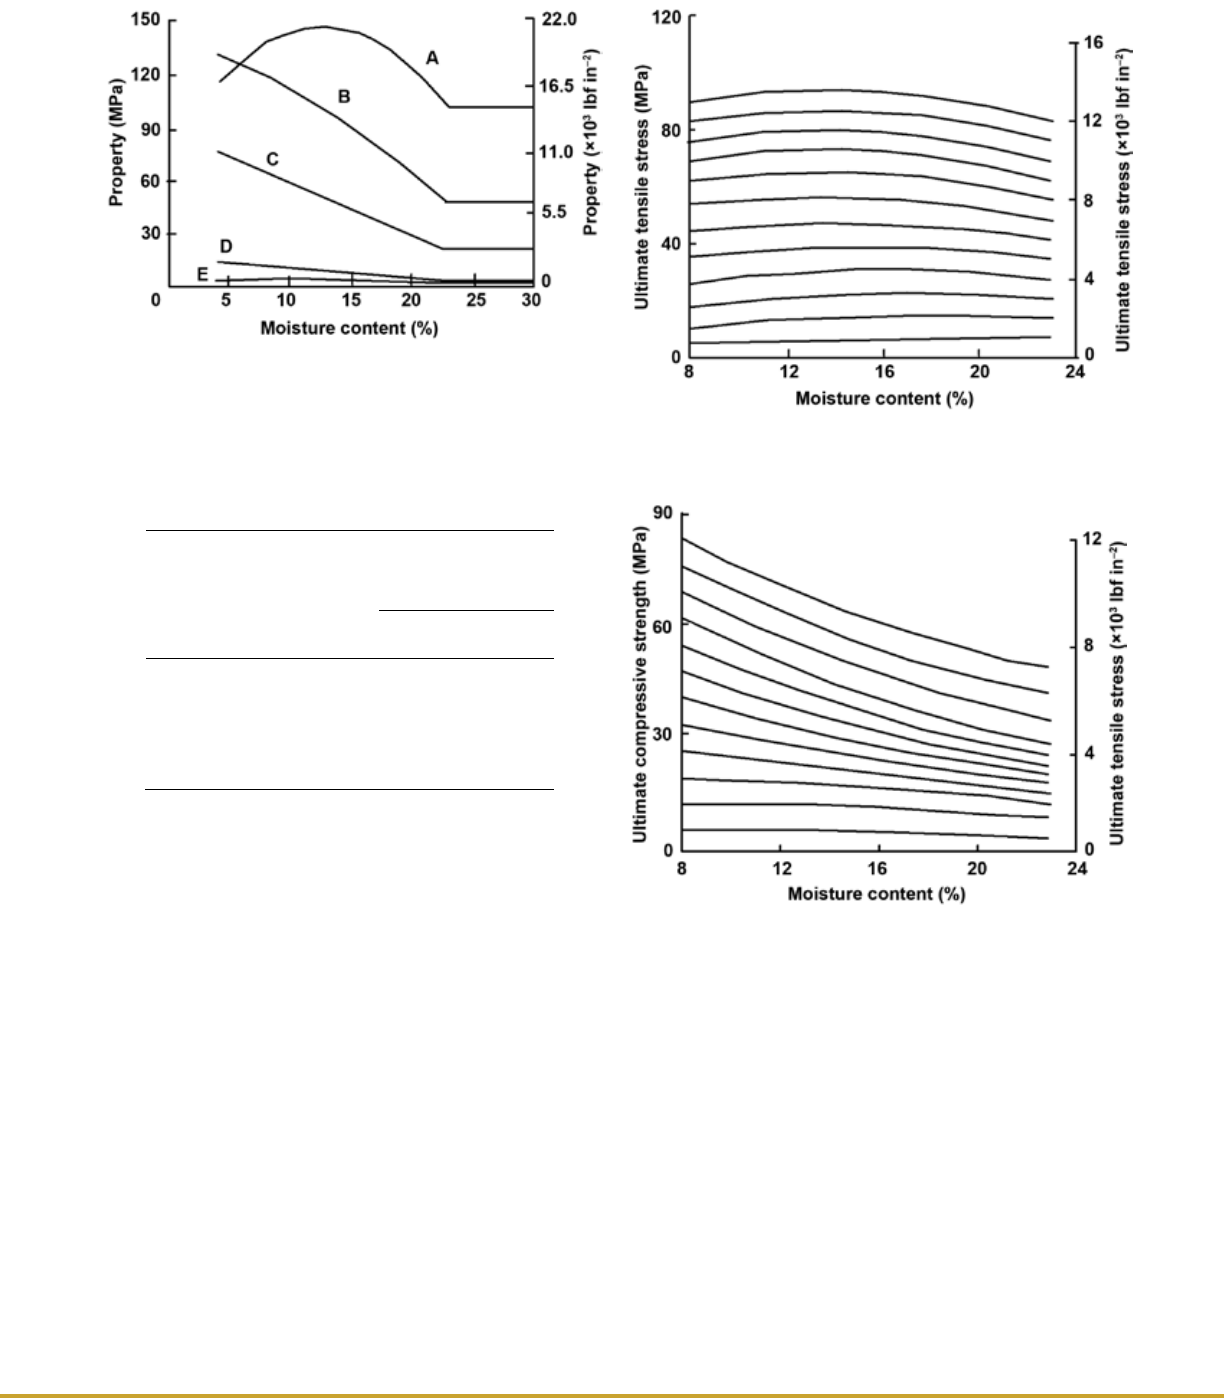
increase while wood is dried to very low moisture con-
tent levels, for most species some properties may reach
a maximum value and then decrease with further drying
(Fig. 5–11) (Kretschmann and Green 1996, 2008). For clear
Southern Pine and yellow poplar, the moisture content at
which a maximum property has been observed is given in
Table 5–14.
This increase in mechanical properties with drying assumes
small, clear specimens in a drying process in which no
deterioration of the product (degrade) occurs. For 51-mm-
(2-in.-) thick lumber containing knots, the increase in prop-
erty with decreasing moisture content is dependent upon
lumber quality. Clear, straight-grained lumber may show
increases in properties with decreasing moisture content
that approximate those of small, clear specimens. However,
as the frequency and size of knots increase, the reduction
in strength resulting from the knots begins to negate the
increase in property in the clear wood portion of the lumber.
Very low quality lumber that has many large knots may be
insensitive to changes in moisture content. Figures 5–12 and
5–13 illustrate the effect of moisture content on the proper-
ties of lumber as a function of initial lumber strength (Green
and others 1989). Application of these results in adjusting
allowable properties of lumber is discussed in Chapter 7.
Additional information on inuences of moisture content
on dimensional stability is included in Chapter 13.
Temperature
Reversible Effects
In general, the mechanical properties of wood decrease
when heated and increase when cooled. At a constant mois-
ture content and below approximately 150 °C (302 °F),
mechanical properties are approximately linearly related
to temperature. The change in properties that occurs when
wood is quickly heated or cooled and then tested at that
condition is termed an immediate effect. At temperatures
Figure 5–11. Effect of moisture content on wood strength
properties. A, tension parallel to grain; B, bending; C, com-
pression parallel to grain; D, compression perpendicular to
grain; and E, tension perpendicular to grain.
Table 5–14. Moisture content for maximum property
value in drying clear Southern Pine and yellow poplar
from green to 4% moisture content
Moisture content
at which peak
property occurs
(%)
Property
Southern
Pine
Yellow
poplar
Ultimate tensile stress
parallel to grain
12.6 8.6
Ultimate tensile stress
perpendicular to grain
10.2 7.1
MOE tension perpendicular to grain 4.3 —
MOE compression parallel to grain 4.3 4.0
Modulus of rigidity, G
RT
10.0 —
Figure 5–12. Effect of moisture content on tensile strength
of lumber parallel to grain.
Figure 5–13. Effect of moisture content on compressive
strength of lumber parallel to grain.
Chapter 5 Mechanical Properties of Wood
5–35
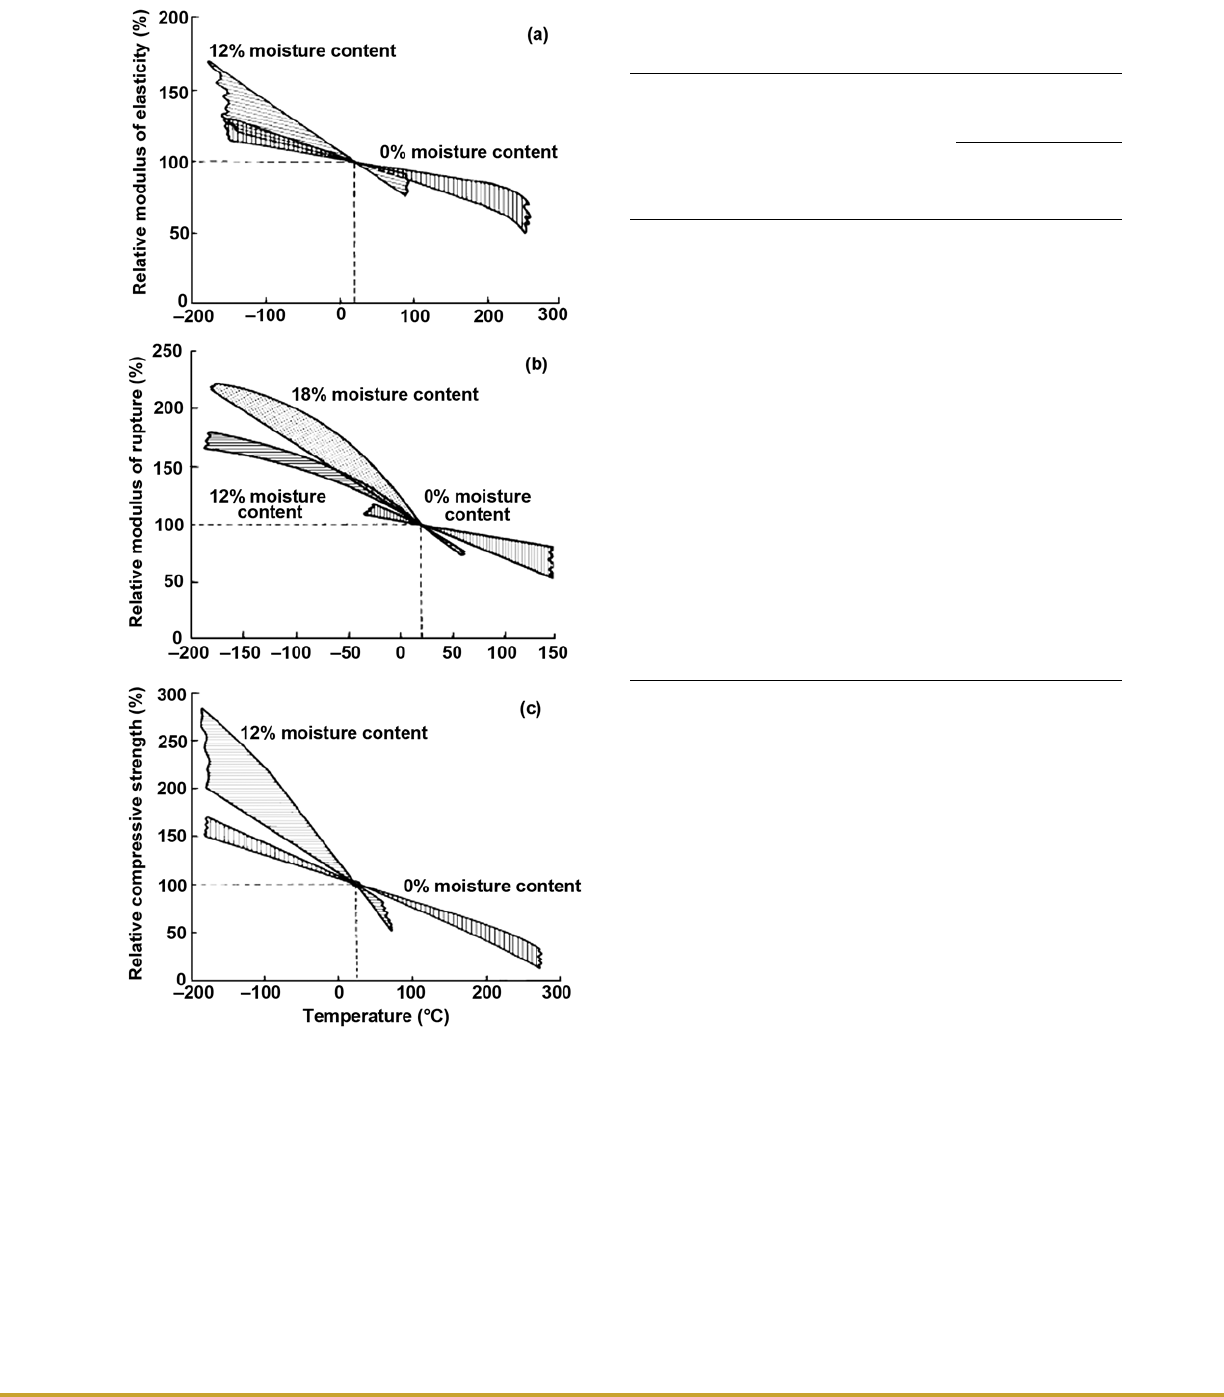
below 100 °C (212 °F), the immediate effect is essentially
reversible; that is, the property will return to the value at the
original temperature if the temperature change is rapid.
Figure 5–14 illustrates the immediate effect of tempera-
ture on modulus of elasticity parallel to grain, modulus of
rupture, and compression parallel to grain, 20 °C (68 °F),
based on a composite of results for clear, defect-free wood.
This gure represents an interpretation of data from several
investigators. The width of the bands illustrates variability
between and within reported trends.
Table 5–15 lists changes in clear wood properties at -50 °C
(-58 °F) and 50 °C (122 °F) relative to those at 20 °C
(68 °F) for a number of moisture conditions. The large
changes at -50 °C (-58 °F) for green wood (at ber satura-
tion point or wetter) reect the presence of ice in the wood
cell cavities.
The strength of dry lumber, at about 12% moisture content,
may change little as temperature increases from -29 °C
(-20 °F) to 38 °C (100 °F). For green lumber, strength gen-
erally decreases with increasing temperature. However, for
temperatures between about 7 °C (45 °F) and 38 °C
(100 °F), the changes may not differ signicantly from those
at room temperature. Table 5–16 provides equations that
Figure 5–14. Immediate effect of temperature at two
moisture content levels relative to value at 20 °C
(68 °F) for clear, defect-free wood: (a) modulus of elas-
ticity parallel to grain, (b) modulus of rupture in bend-
ing, (c) compressive strength parallel to grain. The
plot is a composite of results from several studies.
Variability in reported trends is illustrated by
width of bands.
Table 5–15. Approximate middle-trend effects of
temperature on mechanical properties of clear wood at
various moisture conditions
Relative change in
mechanical property
from 20 °C (68 °F) at:
Property
Moisture
condition
a
(%)
50 °C
(58 °F)
(%)
+50 °C
(+122 °F)
(%)
MOE parallel to grain 0 +11
6
12 +17
7
>FSP +50 —
MOE perpendicular to grain 6 —
20
12 —
35
20
—
38
Shear modulus >FSP —
25
Bending strength
4
+18
10
11–15 +35
20
18–20 +60
25
>FSP +110
25
Tensile strength parallel to grain 0–12 —
4
Compressive strength parallel 0 +20
10
to grain 12–45 +50
25
Shear strength parallel to grain >FSP —
25
Tensile strength perpendicular 4–6 —
10
to grain 11–16 —
20
18
—
30
Compressive strength
perpendicular to grain at
proportional limit
0–6
10
—
—
20
35
a
>FSP indicates moisture content greater than fiber saturation point.
5–36
General Technical Report FPL–GTR–190
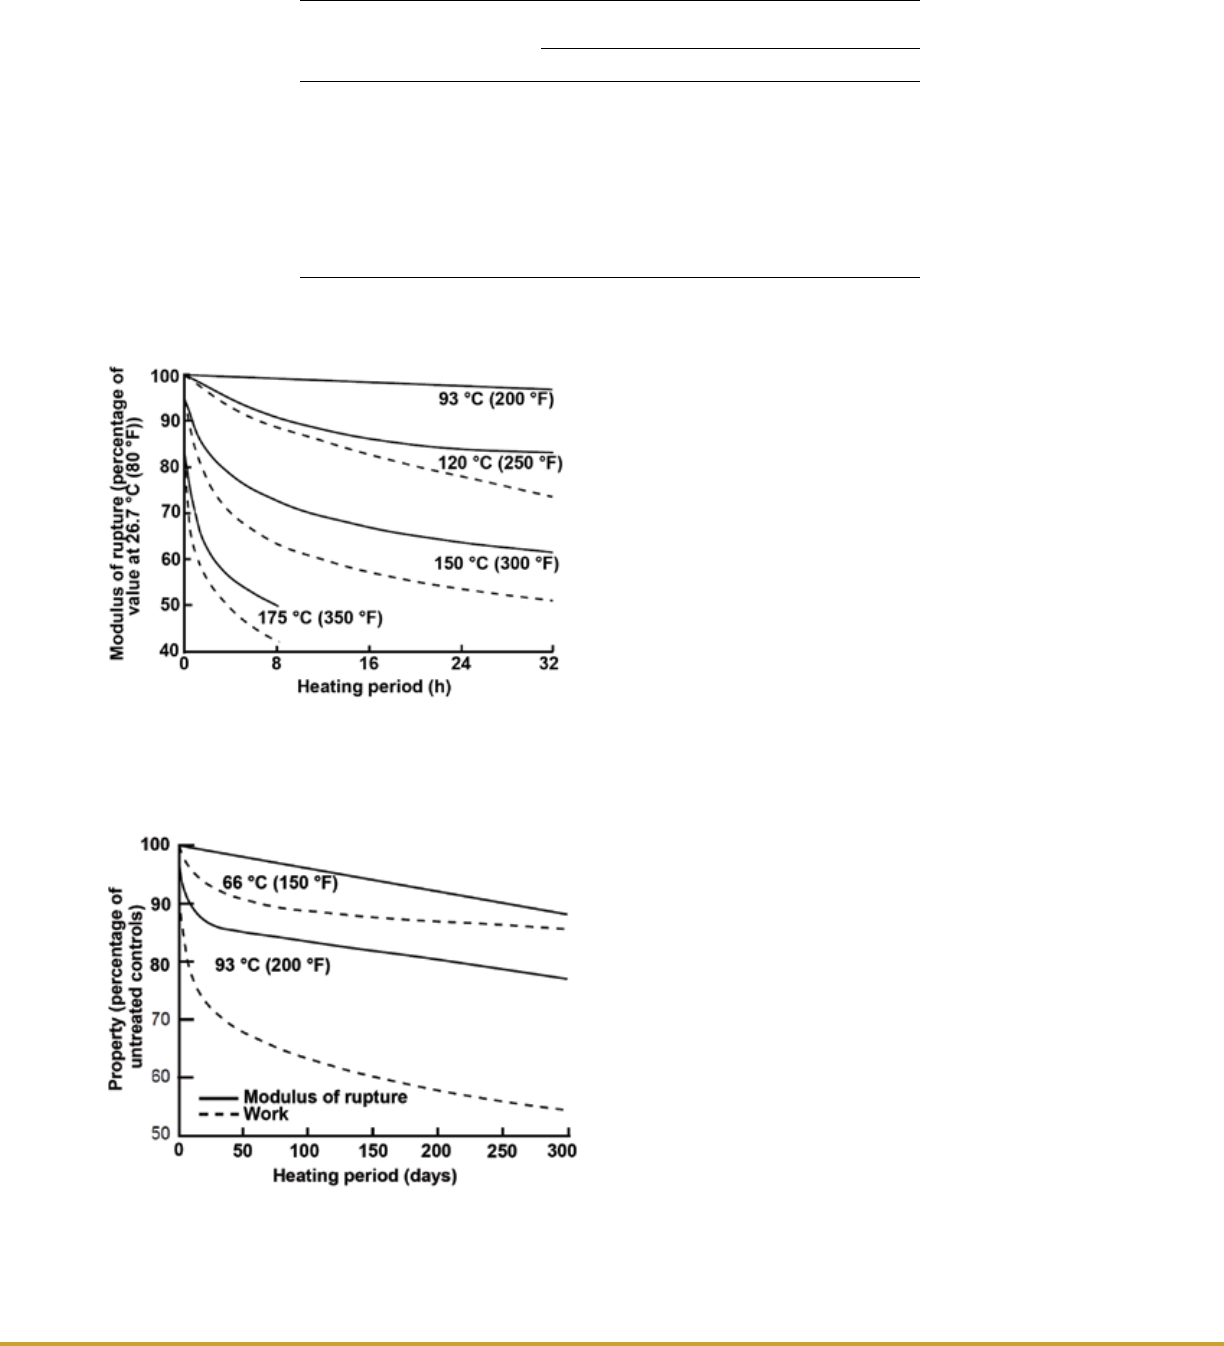
have been used to adjust some lumber properties for the re-
versible effects of temperature.
Irreversible Effects
In addition to the reversible effect of temperature on wood,
there is an irreversible effect at elevated temperature. This
permanent effect is one of degradation of wood substance,
which results in loss of weight and strength. The loss de-
pends on factors that include moisture content, heating
medium, temperature, exposure period, and to some extent,
species and size of piece involved.
The permanent decrease of modulus of rupture caused by
heating in steam and water is shown as a function of tem-
perature and heating time in Figure 5–15, based on tests of
clear pieces of Douglas-r and Sitka spruce. In the same
studies, heating in water affected work to maximum load
more than modulus of rupture (Fig. 5–16). The effect of
heating dry wood (0% moisture content) on modulus of rup-
ture and modulus of elasticity is shown in Figures 5–17 and
5–18, respectively, as derived from tests on four softwoods
and two hardwoods.
Figure 5–19 illustrates the permanent loss in bending
strength of Spruce–Pine–Fir, Southern Pine, and Douglas-
r standard 38- by 89-mm (nominal 2- by 4-in.) lumber
heated at 66 °C (150 °F) and about 12% moisture content.
Figure 5–20 illustrates the permanent loss in bending
strength of Spruce–Pine–Fir, Southern Pine, Douglas-r,
and yellow-poplar standard 38- by 89-mm (nominal 2- by
4-in.) lumber heated at 82 °C (180 °F) and about 12% mois-
ture content. The curves for Spruce–Pine–Fir heated at
66 °C (150 °F) and about 12% moisture content are included
for comparison. The trends in Figure 5–20 can be compared
with the trends in 5–19. In general, there is a greater reduc-
tion in MOR with time at the higher temperature. During
the same time periods shown in Figures 5–19 and 5–20,
modulus of elasticity barely changed. Acid hydrolysis of
hemicellulose, especially of arabinose, appears to be the
fundamental cause of strength loss resulting from thermal
Table 5–16. Percentage change in bending properties of lumber with
change in temperature
a
Property
Lumber
grade
b
Moisture
content
((P–P
70
)/P
70
)100 = A + BT + CT
2
Temperature
range
A B C T
min
T
max
MOE All Green 22.0350
0.4578
0 0 32
Green 13.1215
0.1793
0 32 150
12% 7.8553
0.1108
0
15
150
MOR SS Green 34.13
0.937
0.0043
20
46
Green 0 0 0 46 100
12% 0 0 0
20
100
No. 2 Green 56.89
1.562
0.0072
20
46
or less Green 0 0 0 46 100
Dry 0 0 0
20
100
a
For equation, P is property at temperature T in °F; P
70
, property at 21 °C (70 °F).
b
SS is Select Structural.
Figure 5–15. Permanent effect of heating in water (solid
line) and steam (dashed line) on modulus of rupture of
clear, defect-free wood. All data based on tests of Doug-
las-r and Sitka spruce at room temperature.
Figure 5–16. Permanent effect of heating in water on work
to maximum load and modulus of rupture of clear, defect-
free wood. All data based on tests of Douglas-r and Sitka
spruce at room temperature.
Chapter 5 Mechanical Properties of Wood
5–37
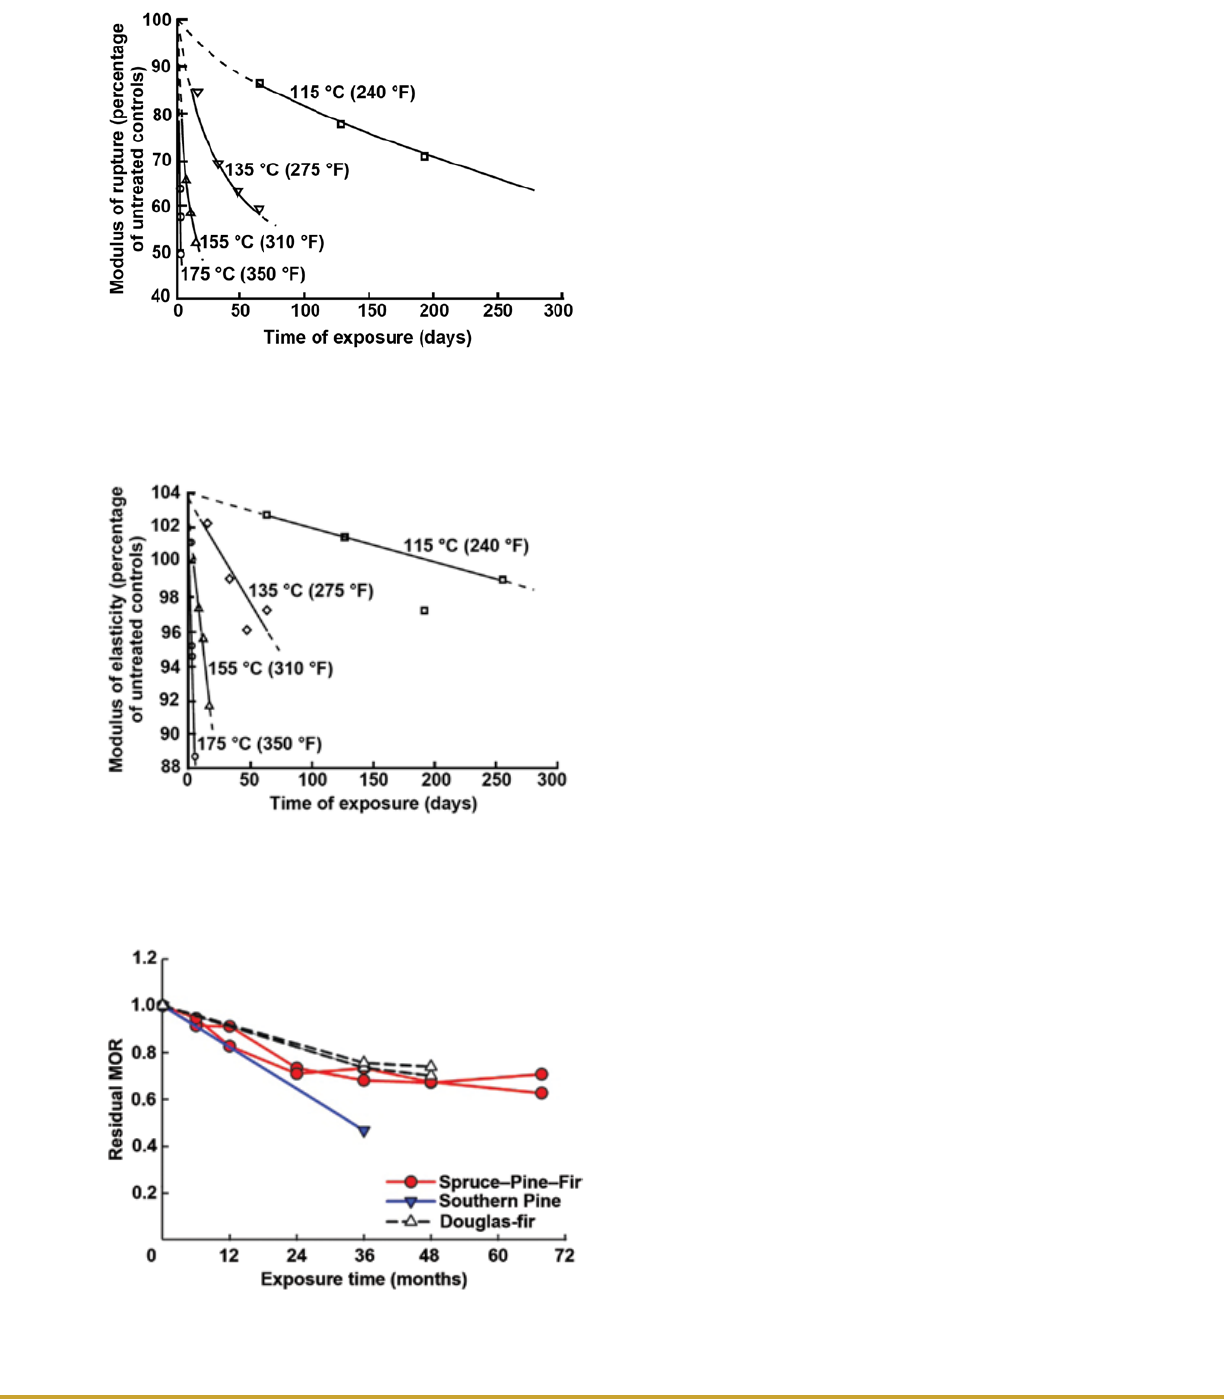
degradation (Green and others 2005). It should be noted that
most in-service exposures at 66 °C (150 °F) or 82 °C
(180 °F) would be expected to result in much lower
moisture content levels.
The permanent property losses discussed here are based on
tests conducted after the specimens were cooled to room
temperature and conditioned to a range of 7% to 12% mois-
ture content. If specimens are tested hot, the percentage of
strength reduction resulting from permanent effects is based
on values already reduced by the immediate effects. Repeat-
ed exposure to elevated temperature has a cumulative effect
on wood properties. For example, at a given temperature the
property loss will be about the same after six 1-month expo-
sures as it would be after a single 6-month exposure.
The shape and size of wood pieces are important in analyz-
ing the inuence of temperature. If exposure is for only a
short time, so that the inner parts of a large piece do not
reach the temperature of the surrounding medium, the im-
mediate effect on strength of the inner parts will be less than
that for the outer parts. However, the type of loading must
be considered. If the member is to be stressed in bending,
the outer bers of a piece will be subjected to the greatest
stress and will ordinarily govern the ultimate strength of the
piece; hence, under this loading condition, the fact that
the inner part is at a lower temperature may be of little
signicance.
For extended noncyclic exposures, it can be assumed that
the entire piece reaches the temperature of the heating me-
dium and will therefore be subject to permanent strength
losses throughout the volume of the piece, regardless of
size and mode of stress application. However, in ordinary
construction wood often will not reach the daily temperature
extremes of the air around it; thus, long-term effects should
be based on the accumulated temperature experience of
critical structural parts.
Time Under Load
Rate of Loading
Mechanical property values, as given in Tables 5–3 to
5–5, are usually referred to as static strength values. Static
strength tests are typically conducted at a rate of loading or
rate of deformation to attain maximum load in about 5 min.
Higher values of strength are obtained for wood loaded at
a more rapid rate, and lower values are obtained at slower
rates. For example, the load required to produce failure in
a wood member in 1 s is approximately 10% higher than
that obtained in a standard static strength test. Over several
orders of magnitude of rate of loading, strength is approxi-
mately an exponential function of rate. See Chapter 7 for
application to treated woods.
Figure 5–21 illustrates how strength decreases with time to
maximum load. The variability in the trend shown is based
on results from several studies pertaining to bending, com-
pression, and shear.
Figure 5–17. Permanent effect of oven heating at four
temperatures on modulus of rupture, based on clear
pieces of four softwood and two hardwood species. All
tests conducted at room temperature.
Figure 5–18. Permanent effect of oven heating at four
temperatures on modulus of elasticity, based on clear
pieces of four softwood and two hardwood species. All
tests conducted at room temperature.
Figure 5–19. Residual MOR for solid-sawn lumber at 66 °C
(150 °F) and 75% relative humidity (Green and others 2003).
5–38
General Technical Report FPL–GTR–190
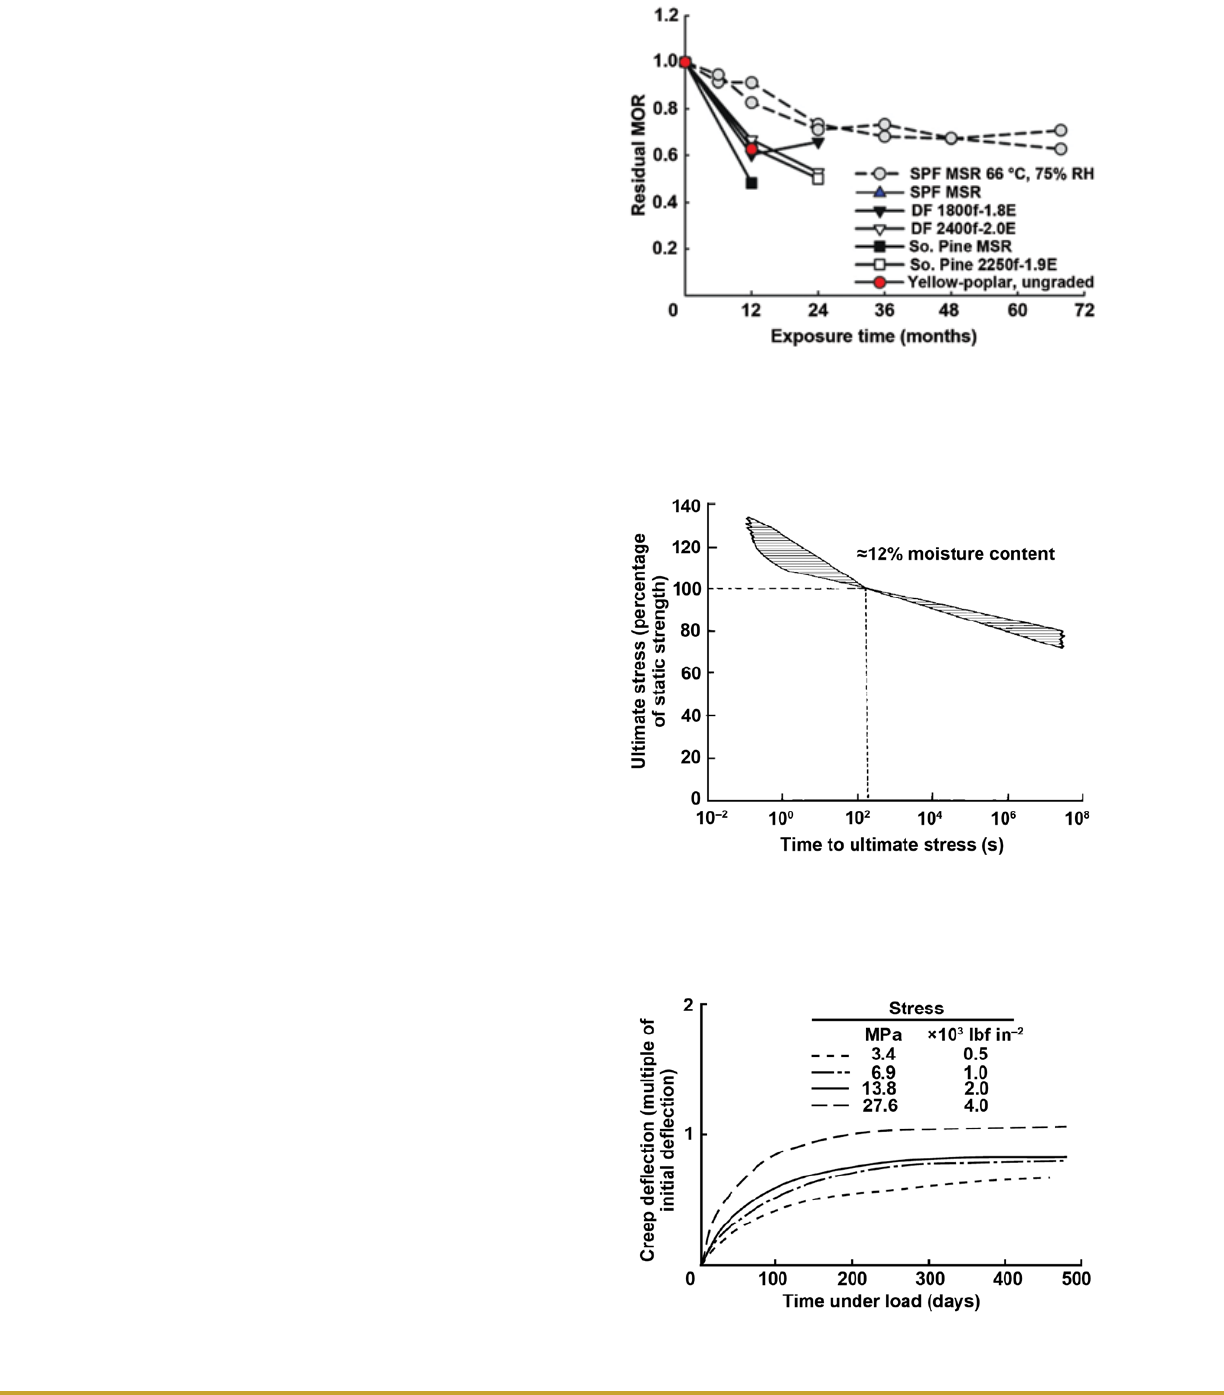
Creep and Relaxation
When initially loaded, a wood member deforms elastically.
If the load is maintained, additional time-dependent defor-
mation occurs. This is called creep. Creep occurs at even
very low stresses, and it will continue over a period of years.
For sufciently high stresses, failure eventually occurs. This
failure phenomenon, called duration of load (or creep rup-
ture), is discussed in the next section.
At typical design levels and use environments, after several
years the additional deformation caused by creep may ap-
proximately equal the initial, instantaneous elastic defor-
mation. For illustration, a creep curve based on creep as a
function of initial deection (relative creep) at several stress
levels is shown in Figure 5–22; creep is greater under higher
stresses than under lower ones.
Ordinary climatic variations in temperature and humidity
will cause creep to increase. An increase of about 28 °C
(50 °F) in temperature can cause a two- to threefold increase
in creep. Green wood may creep four to six times the initial
deformation as it dries under load.
Unloading a member results in immediate and complete
recovery of the original elastic deformation and after time, a
recovery of approximately one-half the creep at deformation
as well. Fluctuations in temperature and humidity increase
the magnitude of the recovered deformation.
Relative creep at low stress levels is similar in bending, ten-
sion, or compression parallel to grain, although it may be
somewhat less in tension than in bending or compression
under varying moisture conditions. Relative creep across the
grain is qualitatively similar to, but likely to be greater than,
creep parallel to the grain. The creep behavior of all species
studied is approximately the same.
If instead of controlling load or stress, a constant deforma-
tion is imposed and maintained on a wood member, the ini-
tial stress relaxes at a decreasing rate to about 60% to 70%
of its original value within a few months. This reduction
of stress with time is commonly called relaxation. In
limited bending tests carried out between approximately
18 °C (64 °F) and 49 °C (120 °F) over 2 to 3 months, the
curve of stress as a function of time that expresses relaxation
is approximately the mirror image of the creep curve (defor-
mation as a function of time). These tests were carried out
at initial stresses up to about 50% of the bending strength of
the wood. As with creep, relaxation is markedly affected by
uctuations in temperature and humidity.
Duration of Load
The duration of load, or the time during which a load acts
on a wood member either continuously or intermittently, is
an important factor in determining the load that the member
can safely carry. The duration of load may be affected by
changes in temperature and relative humidity. The constant
stress that a wood member can sustain is approximately an
Figure 5–20. Residual MOR for solid-sawn lumber at 82 °C
(180 °F) and 80% relative humidity (RH); SPF at 66 °C (150
°F) and 75% RH shown for comparison. SPF is Spruce–
Pine–Fir; MSR, machine stress rated; DF, Douglas-r; and
So. pine, Southern Pine (Green and others 2005).
Figure 5–21. Relationship of ultimate stress at short-time
loading to that at 5-min loading, based on composite of
results from rate-of-load studies on bending, compres-
sion, and shear parallel to grain. Variability in reported
trends is indicated by width of band.
Figure 5–22. Inuence of four levels of stress on creep
(Kingston 1962).
Chapter 5 Mechanical Properties of Wood
5–39
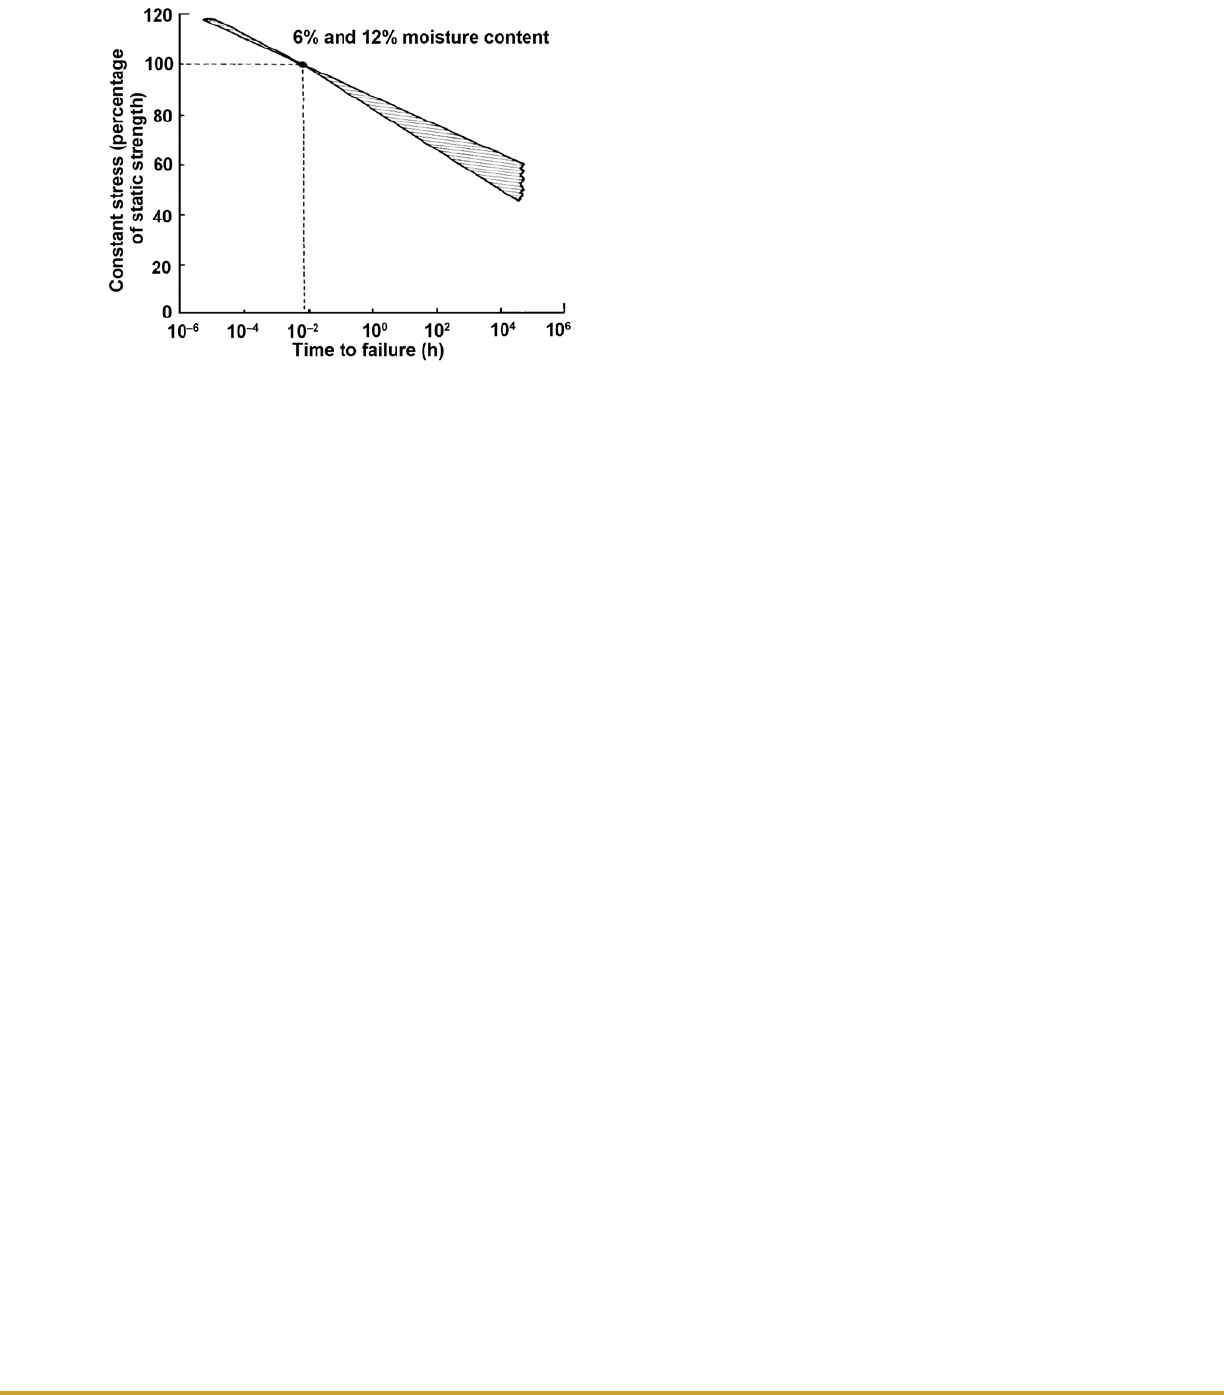
exponential function of time to failure, as illustrated in
Figure 5–22. This relationship is a composite of results of
studies on small, clear wood specimens, conducted at con-
stant temperature and relative humidity.
For a member that continuously carries a load for a long
period, the load required to produce failure is much less than
that determined from the strength properties in Tables 5–3
to 5–5. Based on Figure 5–23, a wood member under the
continuous action of bending stress for 10 years may carry
only 60% (or perhaps less) of the load required to produce
failure in the same specimen loaded in a standard bending
strength test of only a few minutes duration. Conversely, if
the duration of load is very short, the load-carrying capacity
may be higher than that determined from strength properties
given in the tables.
Time under intermittent loading has a cumulative effect.
In tests where a constant load was periodically placed on a
beam and then removed, the cumulative time the load was
actually applied to the beam before failure was essentially
equal to the time to failure for a similar beam under the
same load applied continuously.
The time to failure under continuous or intermittent loading
is looked upon as a creep–rupture process; a member has to
undergo substantial deformation before failure. Deforma-
tion at failure is approximately the same for duration of load
tests as for standard strength tests.
Changes in climatic conditions increase the rate of creep and
shorten the duration during which a member can support
a given load. This effect can be substantial for very small
wood specimens under large cyclic changes in temperature
and relative humidity. Fortunately, changes in temperature
and relative humidity are moderate for wood in the typical
service environment.
Fatigue
In engineering, the term fatigue is dened as the progressive
damage that occurs in a material subjected to cyclic loading.
This loading may be repeated (stresses of the same sign;
that is, always compression or always tension) or reversed
(stresses of alternating compression and tension). When
sufciently high and repetitious, cyclic loading stresses can
result in fatigue failure.
Fatigue life is a term used to dene the number of cycles
that are sustained before failure. Fatigue strength, the maxi-
mum stress attained in the stress cycle used to determine
fatigue life, is approximately exponentially related to fa-
tigue life; that is, fatigue strength decreases approximately
linearly as the logarithm of number of cycles increases.
Fatigue strength and fatigue life also depend on several
other factors: frequency of cycling; repetition or reversal of
loading; range factor (ratio of minimum to maximum stress
per cycle); and other factors such as temperature, moisture
content, and specimen size. Negative range factors imply
repeated reversing loads, whereas positive range factors im-
ply nonreversing loads.
Results from several fatigue studies on wood are given in
Table 5–17. Most of these results are for repeated loading
with a range ratio of 0.1, meaning that the minimum stress
per cycle is 10% of the maximum stress. The maximum
stress per cycle, expressed as a percentage of estimated
static strength, is associated with the fatigue life given in
millions of cycles. The rst three lines of data, which list
the same cyclic frequency (30 Hz), demonstrate the effect of
range ratio on fatigue strength (maximum fatigue stress that
can be maintained for a given fatigue life); fatigue bend-
ing strength decreases as range ratio decreases. Third-point
bending results show the effect of small knots or slope of
grain on fatigue strength at a range ratio of 0.1 and fre-
quency of 8.33 Hz. Fatigue strength is lower for wood con-
taining small knots or a 1-in-12 slope of grain than for clear
straight-grained wood and even lower for wood containing
a combination of small knots and a 1-in-12 slope of grain.
Fatigue strength is the same for a scarf joint in tension as
for tension parallel to the grain, but a little lower for a nger
joint in tension. Fatigue strength is slightly lower in shear
than in tension parallel to the grain. Other comparisons do
not have much meaning because range ratios or cyclic fre-
quency differ; however, fatigue strength is high in compres-
sion parallel to the grain compared with other properties.
Little is known about other factors that may affect fatigue
strength in wood.
Creep, temperature rise, and loss of moisture content occur
in tests of wood for fatigue strength. At stresses that cause
Figure 5–23. Relationship between stress due to constant
load and time to failure for small clear wood specimens,
based on 28 s at 100% stress. The gure is a composite
of trends from several studies; most studies involved
bending but some involved compression parallel to grain
and bending perpendicular to grain. Variability in report-
ed trends is indicated by width of band.
5–40
General Technical Report FPL–GTR–190

failure in about 106 cycles at 40 Hz, a temperature rise of
15 °C (27 °F) has been reported for parallel-to-grain
compression fatigue (range ratio slightly greater than zero),
parallel-to-grain tension fatigue (range ratio = 0), and
reversed bending fatigue (range ratio = -1). The rate of
temperature rise is high initially but then diminishes to mod-
erate; a moderate rate of temperature rise remains more or
less constant during a large percentage of fatigue life. Dur-
ing the latter stages of fatigue life, the rate of temperature
rise increases until failure occurs. Smaller rises in tempera-
ture would be expected for slower cyclic loading or lower
stresses. Decreases in moisture content are probably related
to temperature rise.
Aging
In relatively dry and moderate temperature conditions where
wood is protected from deteriorating inuences such as de-
cay, the mechanical properties of wood show little change
with time. Test results for very old timbers suggest that
signicant losses in clear wood strength occur only after
several centuries of normal aging conditions. The soundness
of centuries-old wood in some standing trees (redwood, for
example) also attests to the durability of wood.
Exposure to Chemicals
The effect of chemical solutions on mechanical proper-
ties depends on the specic type of chemical. Nonswelling
liquids, such as petroleum oils and creosote, have no ap-
preciable effect on properties. Properties are lowered in the
presence of water, alcohol, or other wood-swelling organic
liquids even though these liquids do not chemically degrade
the wood substance. The loss in properties depends largely
on the amount of swelling, and this loss is regained upon
removal of the swelling liquid. Anhydrous ammonia mark-
edly reduces the strength and stiffness of wood, but these
properties are regained to a great extent when the ammonia
is removed. Heartwood generally is less affected than sap-
wood because it is more impermeable. Accordingly, wood
treatments that retard liquid penetration usually enhance
natural resistance to chemicals.
Chemical solutions that decompose wood substance (by hy-
drolysis or oxidation) have a permanent effect on strength.
The following generalizations summarize the effect of
chemicals:
• Some species are quite resistant to attack by dilute min-
eral and organic acids.
• Oxidizing acids such as nitric acid degrade wood more
than do nonoxidizing acids.
• Alkaline solutions are more destructive than are acidic
solutions.
• Hardwoods are more susceptible to attack by both acids
and alkalis than are softwoods.
• Heartwood is less susceptible to attack by both acids and
alkalis than is sapwood.
Because both species and application are extremely impor-
tant, reference to industrial sources with a specic history
of use is recommended where possible. For example, large
cypress tanks have survived long continuous use where ex-
posure conditions involved mixed acids at the boiling point.
Wood is also used extensively in cooling towers because of
its superior resistance to mild acids and solutions of acidic
salts.
Chemical Treatment
Wood is often treated with chemicals to enhance its re per-
formance or decay resistance in service. Each set of treat-
ment chemicals and processes has a unique effect on the
mechanical properties of the treated wood.
Fire-retardant treatments and treatment methods distinctly
reduce the mechanical properties of wood. Some re-retar-
dant-treated products have experienced signicant in-ser-
vice degradation on exposure to elevated temperatures when
used as plywood roof sheathing or roof-truss lumber. New
performance requirements within standards set by ASTM
Table 5–17. Summary of reported results on cyclic
fatigue
a
Property
Range
ratio
Cyclic
fre-
quency
(Hz)
Maximum
stress per
cycle
b
(%)
Approxi-
mate
fatigue
life
(10
6
cycles)
Bending, clear,
straight grain
Cantilever 0.45 30 45 30
Cantilever 0 30 40 30
Cantilever
1.0
30 30 30
Center-point
1.0
40 30 4
Rotational
1.0
— 28 30
Third-point 0.1 8-1/3 60 2
Bending, third-point
Small knots 0.1 8-1/3 50 2
Clear, 1:12 slope
of grain
0.1 8-1/3 50 2
Small knots, 1:12
slope of grain
0.1 8-1/3 40 2
Tension parallel
to grain
Clear, straight grain 0.1 15 50 30
Clear, straight grain 0 40 60 3.5
Scarf joint 0.1 15 50 30
Finger joint 0.1 15 40 30
Compression parallel
to grain
Clear, straight grain 0.1 40 75 3.5
Shear parallel to grain
Glued-laminated 0.1 15 45 30
a
Initial moisture content about 12% to 15%.
b
Percentage of estimated static strength.
Chapter 5 Mechanical Properties of Wood
5–41

International (formerly the American Society for Testing
and Materials) and American Wood Protection Association
(AWPA) preclude commercialization of inadequately per-
forming re-retardant-treated products.
Although preservative treatments and treatment methods
generally reduce the mechanical properties of wood, any
initial loss in strength from treatment must be balanced
against the progressive loss of strength from decay when
untreated wood is placed in wet conditions. The effects
of preservative treatments on mechanical properties are
directly related to wood quality, size, and various pretreat-
ment, treatment, and post-treatment processing factors. The
key factors include preservative chemistry or chemical type,
preservative retention, initial kiln-drying temperature, post-
treatment drying temperature, and pretreatment incising (if
required). North American design guidelines address the
effects of incising on mechanical properties of refractory
wood species and the short-term duration-of-load adjust-
ments for all treated lumber. These guidelines are described
in Chapter 7.
Oil-Type Preservatives
Oil-type preservatives cause no appreciable strength loss
because they do not chemically react with wood cell wall
components. However, treatment with oil-type preservatives
can adversely affect strength if extreme in-retort seasoning
parameters are used (for example, Boultonizing, steaming,
or vapor drying conditions) or if excessive temperatures or
pressures are used during the treating process. To preclude
strength loss, the user should follow specic treatment pro-
cessing requirements as described in the treatment
standards.
Waterborne Preservatives
Waterborne preservative treatments can reduce the mechani-
cal properties of wood. Treatment standards include spe-
cic processing requirements intended to prevent or limit
strength reductions resulting from the chemicals and the
waterborne preservative treatment process. The effects of
waterborne preservative treatment on mechanical properties
are related to species, mechanical properties, preservative
chemistry or type, preservative retention, post-treatment
drying temperature, size and grade of material, product type,
initial kiln-drying temperature, incising, and both tempera-
ture and moisture in service.
Species—The magnitude of the effect of various waterborne
preservatives on mechanical properties does not appear to
vary greatly between different species.
Mechanical property—Waterborne preservatives affect
each mechanical property differently. If treated according
to AWPA standards, the effects are as follows: modulus of
elasticity (MOE), compressive strength parallel to grain,
and compressive stress perpendicular to grain are unaffected
or slightly increased; modulus of rupture (MOR) and ten-
sile strength parallel to grain are reduced from 0% to 20%,
depending on chemical retention and severity of redrying
temperature; and energy-related properties (for example,
work to maximum load and impact strength) are reduced
from 10% to 50%.
Preservative chemistry or type—Waterborne preservative
chemical systems differ in regard to their effect on strength,
but the magnitude of these differences is slight compared
with the effects of treatment processing factors. Chemistry-
related differences seem to be related to the reactivity of
the waterborne preservative and the temperature during the
xation/precipitation reaction with wood.
Retention—Waterborne preservative retention levels of
≤16 kg m
–3
(≤1.0 lb ft
–3
) have no effect on MOE or com-
pressive strength parallel to grain and a slight negative
effect (-5% to -10%) on tensile or bending strength. How-
ever, energy-related properties are often reduced from 15%
to 30%. At a retention level of 40 kg m
–3
(2.5 lb ft
–3
), MOR
and energy-related properties are further reduced.
Post-treatment drying temperature—Air drying af-
ter treatment causes no signicant reduction in the static
strength of wood treated with waterborne preservative at a
retention level of 16 kg m
–3
(1.0 lb ft
–3
). However, energy-
related properties are reduced. The post-treatment redrying
temperature used for material treated with waterborne pre-
servative has been found to be critical when temperatures
exceed 75 °C (167 °F). Redrying limitations in treatment
standards have precluded the need for an across-the-board
design adjustment factor for waterborne-preservative-treat-
ed lumber in engineering design standards. The limitation
on post-treatment kiln-drying temperature is set at 74 °C
(165 °F).
Size of material—Generally, larger material, specically
thicker, appears to undergo less reduction in strength than
does smaller material. Recalling that preservative treatments
usually penetrate the treated material to a depth of only
6 to 51 mm (0.25 to 2.0 in.), depending on species and other
factors, the difference in size effect appears to be a function
of the product’s surface-to-volume ratio, which affects the
relative ratio of treatment-induced weight gain to original
wood weight.
Grade of material—The effect of waterborne preserva-
tive treatment is a quality-dependent phenomenon. Higher
grades of wood are more affected than lower grades. When
viewed over a range of quality levels, higher quality lumber
is reduced in strength to a proportionately greater extent
than is lower quality lumber.
Product type—The magnitude of the treatment effect on
strength for laminated veneer lumber conforms closely to
effects noted for higher grades of solid-sawn lumber. The
effects of waterborne preservative treatment on plywood
seem comparable to that on lumber. Fiber-based composite
5–42
General Technical Report FPL–GTR–190

products may be reduced in strength to a greater extent than
is lumber. This additional effect on ber-based composites
may be more a function of internal bond damage caused by
waterborne-treatment-induced swelling rather than actual
chemical hydrolysis.
Initial kiln-drying temperature—Although initial kiln
drying of some lumber species at 100 to 116 °C (212 to
240 °F) for short durations has little effect on structural
properties, such drying results in more hydrolytic degrada-
tion of the cell wall than does drying at lower temperature
kiln schedules. Subsequent preservative treatment and re-
drying of material initially dried at high temperatures cause
additional hydrolytic degradation. When the material is sub-
sequently treated, initial kiln drying at 113 °C (235 °F) has
been shown to result in greater reductions over the entire
bending and tensile strength distributions than does initial
kiln drying at 91 °C (196 °F). Because Southern Pine
lumber, the most widely treated product, is most often ini-
tially kiln dried at dry-bulb temperatures near or above
113 °C (235 °F), treatment standards have imposed a maxi-
mum redrying temperature limit of 74 °C (165 °F) to pre-
clude the cumulative effect of thermal processing.
Incising—Incising, a pretreatment mechanical process in
which small slits (incisions) are punched in the surface of
the wood product, is used to improve preservative penetra-
tion and distribution in difcult-to-treat species. Incising
may reduce strength; however, because the increase in
treatability provides a substantial increase in biological
performance, this strength loss must be balanced against the
progressive loss in strength of untreated wood from the inci-
dence of decay. Most incising patterns induce some strength
loss, and the magnitude of this effect is related to the size
of material being incised and the incision depth and density
(that is, number of incisions per unit area). In <50-mm-
(<2-in.-) thick, dry lumber, incising and preservative treat-
ment induces losses in MOE of 5% to 15% and in static
strength properties of 20% to 30%. Incising and treating
timbers or tie stock at an incision density of ≤1,500 inci-
sions m
–2
(≤140 incisions ft
–2
) and to a depth of 19 mm
(0.75 in.) reduces strength by 5% to 10%.
In-service temperature—Both re-retardant and preserva-
tive treatments accelerate the thermal degradation of bend-
ing strength of lumber when exposed to temperatures above
54 °C (130 °F).
In-service moisture content—Current design values apply
to material dried to ≤19% maximum (15% average) mois-
ture content or to green material. No differences in strength
have been found between treated and untreated material
when tested green or at moisture contents above 12%.
When very dry treated lumber of high grade was tested at
10% moisture content, its bending strength was reduced
compared with that of matched dry untreated lumber.
Duration of load—When subjected to impact loads, wood
treated with chromated copper arsenate (CCA) does not
exhibit the same increase in strength as that exhibited by
untreated wood. However, when loaded over a long period,
treated and untreated wood behave similarly.
Polymerization
Wood is also sometimes impregnated with monomers, such
as methyl methacrylate, which are subsequently polymer-
ized. Many of the mechanical properties of the resultant
wood–plastic composite are greater than those of the origi-
nal wood, generally as a result of lling the void spaces in
the wood structure with plastic. The polymerization process
and both the chemical nature and quantity of monomers in-
uence composite properties.
Nuclear Radiation
Wood is occasionally subjected to nuclear radiation. Exam-
ples are wooden structures closely associated with nuclear
reactors, the polymerization of wood with plastic using
nuclear radiation, and nondestructive estimation of wood
density and moisture content. Very large doses of gamma
rays or neutrons can cause substantial degradation of wood.
In general, irradiation with gamma rays in doses up to about
10 kGy has little effect on the strength properties of wood.
As dosage exceeds 10 kGy, tensile strength parallel to grain
and toughness decrease. At a dosage of 3 MGy, tensile
strength is reduced about 90%. Gamma rays also affect
compressive strength parallel to grain at a dosage above
10 kGy, but higher dosage has a greater effect on tensile
strength than on compressive strength; only approximately
one-third of compressive strength is lost when the total
dose is 3 MGy. Effects of gamma rays on bending and shear
strength are intermediate between the effects on tensile and
compressive strength.
Mold and Stain Fungi
Mold and stain fungi do not seriously affect most mechani-
cal properties of wood because such fungi feed on substanc-
es within the cell cavity or attached to the cell wall rather
than on the structural wall itself. The duration of infection
and the species of fungi involved are important factors in
determining the extent of degradation.
Although low levels of biological stain cause little loss in
strength, heavy staining may reduce specic gravity by 1%
to 2%, surface hardness by 2% to 10%, bending and crush-
ing strength by 1% to 5%, and toughness or shock resistance
by 15% to 30%. Although molds and stains usually do not
have a major effect on strength, conditions that favor these
organisms also promote the development of wood-destroy-
ing (decay) fungi and soft-rot fungi (Chap. 14). Pieces with
mold and stain should be examined closely for decay if they
are used for structural purposes.
Decay
Unlike mold and stain fungi, wood-destroying (decay) fungi
seriously reduce strength by metabolizing the cellulose frac-
tion of wood that gives wood its strength.
Chapter 5 Mechanical Properties of Wood
5–43

Early stages of decay are virtually impossible to detect. For
example, brown-rot fungi may reduce mechanical proper-
ties in excess of 10% before a measurable weight loss is
observed and before decay is visible. When weight loss
reaches 5% to 10%, mechanical properties are reduced from
20% to 80%. Decay has the greatest effect on toughness,
impact bending, and work to maximum load in bending, the
least effect on shear and hardness, and an intermediate ef-
fect on other properties. Thus, when strength is important,
adequate measures should be taken to (a) prevent decay
before it occurs, (b) control incipient decay by remedial
measures (Chap. 14), or (c) replace any wood member in
which decay is evident or believed to exist in a critical sec-
tion. Decay can be prevented from starting or progressing if
wood is kept dry (below 20% moisture content).
No method is known for estimating the amount of reduc-
tion in strength from the appearance of decayed wood.
Therefore, when strength is an important consideration, the
safe procedure is to discard every piece that contains even
a small amount of decay. An exception may be pieces in
which decay occurs in a knot but does not extend into the
surrounding wood.
Insect Damage
Insect damage may occur in standing trees, logs, and un-
dried (unseasoned) or dried (seasoned) lumber. Although
damage is difcult to control in the standing tree, insect
damage can be eliminated to a great extent by proper con-
trol methods. Insect holes are generally classied as pin-
holes, grub holes, and powderpost holes. Because of their
irregular burrows, powderpost larvae may destroy most of
a piece’s interior while only small holes appear on the sur-
face, and the strength of the piece may be reduced virtually
to zero. No method is known for estimating the reduction
in strength from the appearance of insect-damaged wood.
When strength is an important consideration, the safe proce-
dure is to eliminate pieces containing insect holes.
Literature Cited
Bendtsen, B.A.; Ethington, R.L.1975. Mechanical properties
of 23 species of eastern hardwoods. Res. Note FPL–RN–
0230. Madison, WI: U.S. Department of Agriculture, Forest
Service, Forest Products Laboratory. 12 p.
Bodig, J.; Jayne, B.A. 1982. Mechanics of wood and wood
composites. New York: Van Nostrand Reinhold Company.
Green, D.W.; Evans, J.W.; Craig, B.A. 2003. Durability of
structural lumber products at high temperatures I: 66°C at
75% RH and 82°C at 30% RH. Wood and Fiber Science.
35(4): 499–523.
Green, D.W.; Evans, J.W.; Hateld, C.A.; Byrd, P.J. 2005.
Durability of structural lumber products after exposure at
82°C and 80% relative humidity. Res. Pap. FPL–RP–631.
Madison, WI: U.S. Department of Agriculture, Forest Ser-
vice, Forest Products Laboratory. 21 p.
Green, D.W.; Shelley, B.E.; Vokey, H.P., eds. 1989. In-grade
testing of structural lumber. Proceedings 47363. Madison,
WI: Forest Products Society.
Kingston, R.S.T. 1962. Creep, relaxation, and failure of
wood. Research Applied in Industry. 15(4).
Kretschmann, D.E. 2008. The inuence of juvenile wood
content on shear parallel, compression and tension perpen-
dicular to grain strength and mode I fracture toughness of
loblolly pine at various ring orientations. Forest Products
Journal. 58(7/8): 89–96.
Kretschmann, D.E.; Green, D.W. 1996. Modeling moisture
content–mechanical property relationships for clear South-
ern Pine. Wood and Fiber Science. 28(3): 320–337.
Kretschmann, D.E.; Green, D.W. 2008. Strength properties
of low moisture content yellow-poplar. In: Proceedings,
world conference timber engineering; 2008 June 2–5; Mi-
yazaki, Japan: WCTE. 8p.
Moon, R.J.; Frihart, C.R., Wegner, T. 2006. Nanotechnology
applications in the forest products industry. Forest Products
Journal. (56)5: 4–10.
Additional References
ASTM. [Current edition]. Standard methods for testing
small clear specimens of timber. ASTM D143–94. West
Conshohocken, PA: American Society for Testing and
Materials.
Bendtsen, B.A. 1976. Rolling shear characteristics of nine
structural softwoods. Forest Products Journal. 26(11):
51–56.
Bendtsen, B.A.; Freese, F.; Ethington, R.L. 1970. Methods
for sampling clear, straight-grained wood from the forest.
Forest Products Journal. 20(11): 38–47.
Bodig, J.; Goodman, J.R. 1973. Prediction of elastic
parameters for wood. Wood Science. 5(4): 249–264.
Boller, K.H. 1954. Wood at low temperatures. Modern
Packaging. 28(1): 153–157.
Chudnoff, M. 1984. Tropical timbers of the world. Agricul-
ture Handbook 607. Madison, WI: U.S. Department of Agri-
culture, Forest Service, Forest Products Laboratory. 464 p.
Coffey, D.J. 1962. Effects of knots and holes on the fatigue
strength of quarter-scale timber bridge stringers. Madison,
WI: University of Wisconsin, Department of Civil Engineer-
ing. M.S. thesis.
Gerhards, C.C. 1968. Effects of type of testing equipment
and specimen size on toughness of wood. Res. Pap.
FPL–RP–97. Madison, WI: U.S. Department of Agriculture,
Forest Service, Forest Products Laboratory. 12 p.
Gerhards, C.C. 1977. Effect of duration and rate of loading
on strength of wood and wood based materials. Res. Pap.
5–44
General Technical Report FPL–GTR–190

FPL–RP–283. Madison, WI: U.S. Department of Agricul-
ture, Forest Service, Forest Products Laboratory. 24 p.
Gerhards, C.C. 1979. Effect of high-temperature drying on
tensile strength of Douglas-r 2 by 4s. Forest Products
Journal. 29(3): 39–46.
Gerhards, C.C. 1982. Effect of moisture content and tem-
perature on the mechanical properties of wood: an analysis
of immediate effects. Wood and Fiber. 14(1): 4–36.
Green, D.W.; Evans, J.W. 1994. Effect of ambient tem-
peratures on the exural properties of lumber. In: PTEC
94 timber shaping the future: Proceedings, Pacic timber
engineering conference; 1994 July 11–15; Gold Coast, Aus-
tralia. Fortitude Valley MAC, Queensland, Australia: Timber
Research Development and Advisory Council: 190–197.
Vol. 2.
Green, D.W.; Evans J.W.; Logan J.D.; Nelson, W.J. 1999.
Adjusting modulus of elasticity of lumber for changes in
temperature. Madison, WI: Forest Products Society. Forest
Products Journal. 49(10): 82–94.
Green, D.W.; Rosales, A. 1996. Property relationships for
tropical hardwoods. In: Proceedings, international wood
engineering conference; 1996 October 21–31; New Orleans,
LA. Madison, WI: Forest Products Society: 3-516–3-521.
Hearmon, R.F.S. 1948. The elasticity of wood and plywood.
Special Rep. 7. London, England: Department of Scientic
and Industrial Research, Forest Products Research.
Hearmon, R.F.S. 1961. An introduction to applied anisotro-
pic elasticity. London, England: Oxford University Press.
Kollmann, F.F.P.; Cote, W.A., Jr. 1968. Principles of wood
science and technology. New York: Springer–Verlag.
Koslik, C.J. 1967. Effect of kiln conditions on the strength
of Douglas-r and western hemlock. Rep. D–9. Corvallis,
OR: Oregon State University, School of Forestry, Forestry
Research Laboratory.
Kretschmann, D.E.; Bendtsen, B.A. 1992. Ultimate tensile
stress and modulus of elasticity of fast-grown plantation lob-
lolly pine lumber. Wood and Fiber Science. 24(2): 189–203.
Kretschmann, D.E.; Green, D.W.; Malinauskas, V. 1991.
Effect of moisture content on stress intensity factors in
Southern Pine. In: Proceedings, 1991 international timber
engineering conference; 1991 September 2–5; London.
London: TRADA: 3.391–3.398. Vol. 3.
LeVan, S.L.; Winandy, J.E. 1990. Effects of re-retardant
treatments on wood strength: a review. Wood and Fiber
Science. 22(1): 113–131.
Little, E.L., Jr. 1979. Checklist of United States trees (native
and naturalized). Agric. Handb. 541. Washington, DC: U.S.
Department of Agriculture. 375 p.
MacLean, J.D. 1953. Effect of steaming on the strength of
wood. American Wood-Preservers’ Association. 49: 88–112.
MacLean, J.D. 1954. Effect of heating in water on the
strength properties of wood. American Wood-Preservers’
Association. 50: 253–281.
Mallory, M.P.; Cramer, S. 1987. Fracture mechanics: a tool
for predicting wood component strength. Forest Products
Journal. 37(7/8): 39–47.
Mark, R.E.; Adams, S.F.; Tang, R.C. 1970. Moduli of rigid-
ity of Virginia pine and tulip poplar related to moisture con-
tent. Wood Science. 2(4): 203–211.
McDonald, K.A.; Bendtsen, B.A. 1986. Measuring local-
ized slope of grain by electrical capacitance. Forest Products
Journal. 36(10): 75–78.
McDonald, K.A.; Hennon, P.E.; Stevens, J.H.; Green, D.W.
1997. Mechanical properties of salvaged yellow-cedar in
southeastern Alaska—Phase I. Res. Pap. FPL–RP–565.
Madison, WI: U.S. Department of Agriculture, Forest Ser-
vice, Forest Products Laboratory.
Millett, M.A.; Gerhards, C.C. 1972. Accelerated aging: re-
sidual weight and exural properties of wood heated in air
at 115°C to 175°C. Wood Science. 4(4): 193–201.
Nicholas, D.D. 1973. Wood deterioration and its prevention
by preservative treatments. In: Degradation and Protection
of Wood. Syracuse, NY: Syracuse University Press. Vol. I.
Pillow, M.Y. 1949. Studies of compression failures and their
detection in ladder rails. Rep. D 1733. Madison, WI: U.S.
Department of Agriculture, Forest Service, Forest Products
Laboratory.
Sliker, A.; Yu, Y. 1993. Elastic constants for hardwoods
measured from plate and tension tests. Wood and Fiber
Science. 25(1): 8–22.
Sliker, A.; Yu, Y.; Weigel, T.; Zhang, W. 1994. Orthotropic
elastic constants for eastern hardwood species. Wood and
Fiber Science. 26(1): 107–121.
Soltis, L.A.; Winandy, J.E. 1989. Long-term strength of
CCA-treated lumber. Forest Products Journal. 39(5): 64–68.
Timell, T.E. 1986. Compression wood in gymnosperms. Vol.
I–III. Berlin: Springer–Verlag.
U.S. Department of Defense. 1951. Design of wood aircraft
structures. ANC–18 Bull. Subcommittee on Air Force–Navy
Civil Aircraft, Design Criteria Aircraft Commission. 2nd ed.
Munitions Board Aircraft Committee.
Wangaard, F.F. 1966. Resistance of wood to chemical degra-
dation. Forest Products Journal. 16(2): 53–64.
Wilcox, W.W. 1978. Review of literature on the effects of
early stages of decay on wood strength. Wood and Fiber Sci-
ence. 9(4): 252–257.
Chapter 5 Mechanical Properties of Wood
5–45

Wilson, T.R.C. 1921. The effect of spiral grain on the
strength of wood. Journal of Forestry. 19(7): 740–747.
Wilson, T.R.C. 1932. Strength-moisture relations for wood.
Tech. Bull. 282. Washington, DC: U.S. Department of
Agriculture.
Winandy, J.E. 1994. Effects of long-term elevated tempera-
ture on CCA-treated Southern Pine lumber. Forest Products
Journal. 44(6): 49–55.
Winandy, J.E. 1995a. Effects of waterborne preservative
treatment on mechanical properties: a review. In: Proceed-
ings, 91st annual meeting of American Wood Preservers’
Association; 1995, May 21–24; New York, NY. Woodstock,
MD: American Wood Preservers’ Association. 91: 17–33.
Winandy, J.E. 1995b. The inuence of time to failure on the
strength of CCA treated lumber. Forest Products Journal.
45(2): 82–85.
Winandy, J.E. 1995c. Effects of moisture content on
strength of CCA-treated lumber. Wood and Fiber Science.
27(2): 168–177.
Winandy, J.E.; Morrell, J.J. 1993. Relationship between in-
cipient decay, strength, and chemical composition of Doug-
las-r heartwood. Wood and Fiber Science. 25(3): 278–288.
Woodn, R.O.; Estep, E.M., eds. 1978. In: The dead timber
resource. Proceedings, 1978 May 22–24, Spokane, WA.
Pullman, WA: Engineering Extension Service, Washington
State University.
5–46
General Technical Report FPL–GTR–190
