
PropInde
x | Magicbricks
Mumbai
JAN-
MAR 2024
Residentia
l Market Insights
Marke
t Dynamics
Mumbai market post navigating through a dull period, resurrects to a high demand market share
Parameters India Mumbai
Notes:
Above parameters represent QoQ change in Q1 2024 at
India and city level
+ change in volume of propert y searches
++change in volume of act ive list ings
+++ change in the average rate of under-construct ion
(UC) and ready-to-move (RM) properties
Source: M agicbricks Research
RM Rate Change
" RM segment
recorded QoQ price
growth of 4.4%."
Key developers based on active
listings
Note: The above table represents the top
developers by the share of active listings on
Magicbricks website in Q1 2024.
In the News
1. In Q4 2023, Mumbai Metropolitan Region
maintained its strong performance as
India's top residential market with 46,638
transactions totaling Rs 39,170 crore, based
on IGR data.
2. In 2023, residential sales in India's top
seven cities (Mumbai, Delhi NCR,
Bengaluru, Hyderabad, Chennai, Kolkata,
and Pune) reached a record high of 271,818
units, marking a 25% increase over the
previous peak in 2010.
© m agicbricks .com
Page 2
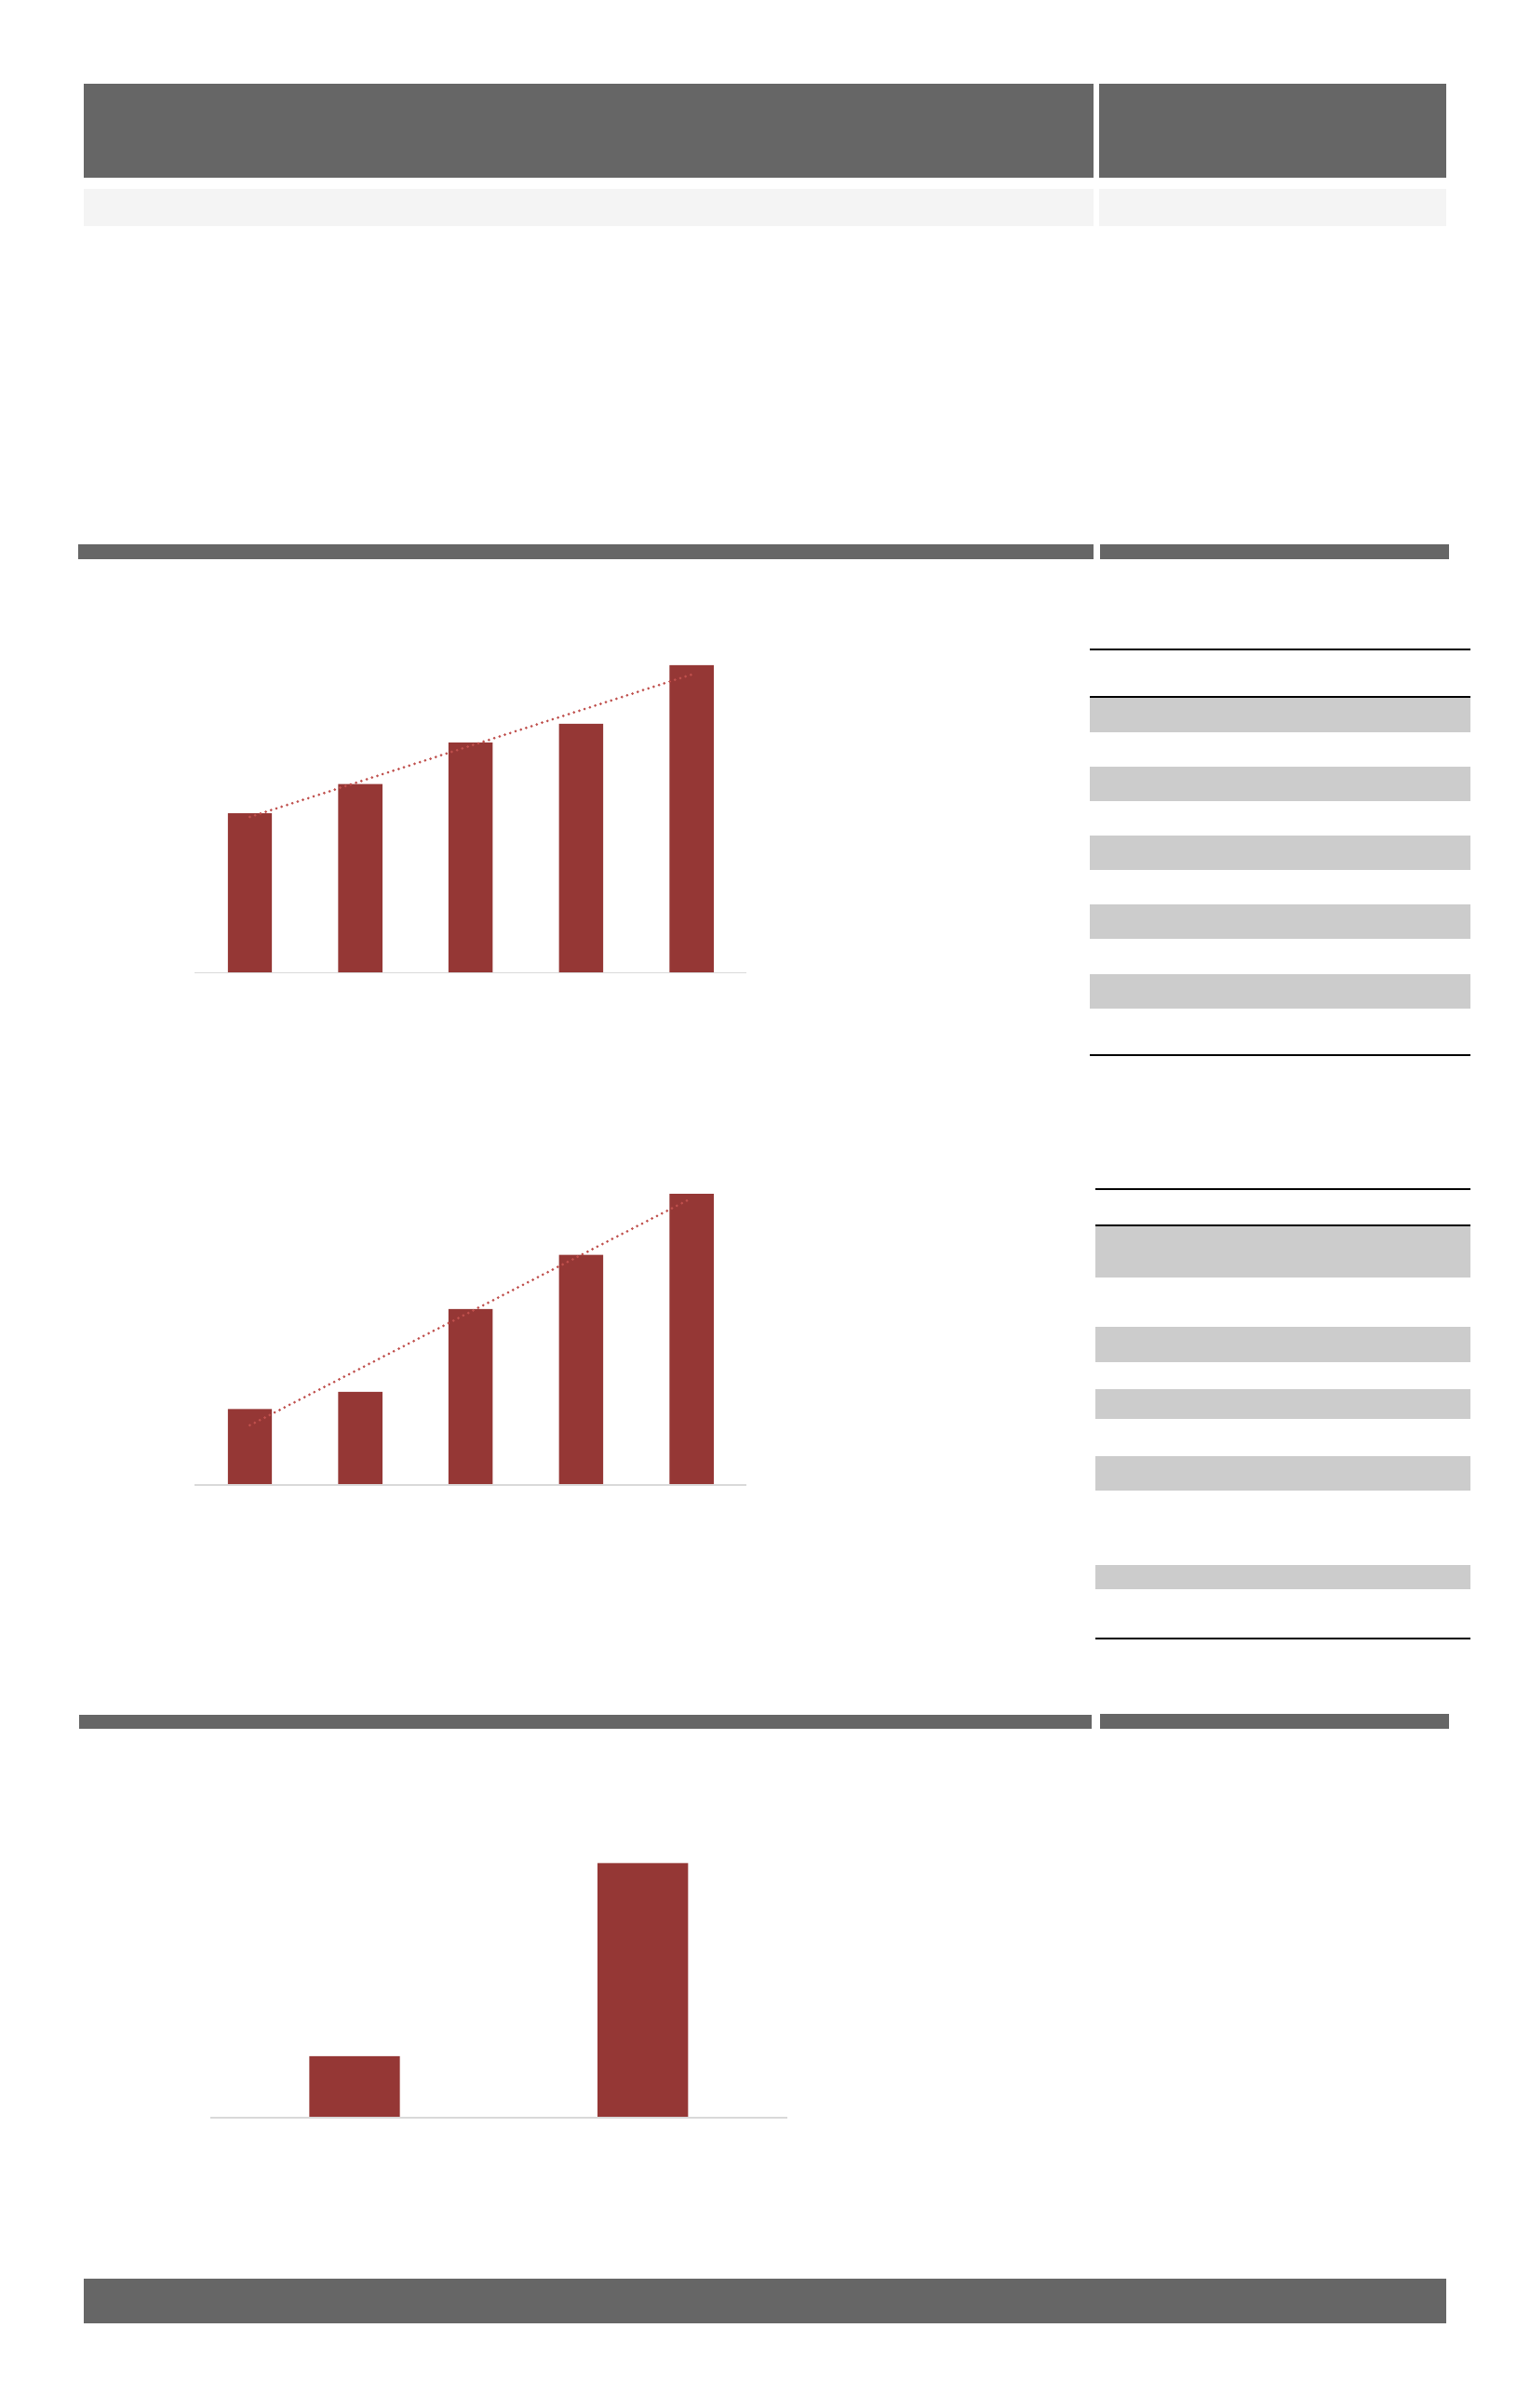
Supply change of RM vs UC properties
" B o t h RM and UC
segment recorded a
QoQ increase of
1.1% and 4.4%
respectively in supply
share.”
1.1%
4.4%
0.0%
1.0%
2.0%
3.0%
4.0%
5.0%
RM UC
QoQ change in supply
In Q1 2024, the residential market in Mumbai saw a growth of 3.1% QoQ in demand, as reflected in search activity.
However, there was a decline of 1.1% QoQ in residential listings. Prices of residential properties showed a modest 5%
QoQ increase.
Numerous major multinational corporations and prominent players in the entertainment industry have chosen
Mumbai as their base, attracted by its status as the financial hub of India. This city has experienced remarkable
economic expansion, fostering a robust job market and elevating living standards. Consequently, there is a significant
upsurge in demand for residential real estate, promising substantial returns on investment due to the city's flourishing
economy and increasing prosperity. After enduring a period of sluggishness, the Mumbai market experiences a
revival, bouncing back to become a sought-after market with increased demand and a significant share of the market.
Demand+
Supply++
Rate Index+++
6.9%
0.9%
2.9%
3.1%
-1..1%
5.0%
Note:
1. Above table represents the rate changes for RM and UC properties for dominant asset classes in each locality under various rate buckets (INR psf) as of March 2024
Source: Magicbricks Research
UC Rate Change
“ UC segment
recorded QoQ price
growth of 5.7%."
Project
Locality
Lodha Woods
Kandivali East
VKG Krishna
Residences
Chakala
Dotom Isle
Malad West
Auris Serenity
Malad West
Oberoi Springs
Andheri West
Atmiya Centria
Santacruz East
Ruparel Panache
Santacruz West
White City Phase 2
Wing B
Lokhandwala
Township Kandivali
East
Romell Orbis
Andheri East
Lodha Eternis
Chakala
Industrial
Area MIDC
Key Projects and Localities
Notes:
1. RM rate index represents the weighted average rate of completed properties on the Magicbricks website as of March 2024.
2. UC rate index represents the weighted average rate of under-construction properties on the Magicbricks website as of March 2024.
3. The graph represents the average rate of the dominant asset class in each locality of the city.
Source: Magicbricks Research
Note: Above table lists the most searched projects on
Magicbricks website in Q1 2024
Source: Magicbricks Research
Developer
Lodha
Rajesh LifeSpaces
Vijay Khetan Group
Oberoi Realty Ltd.
Ruparel Realty
The Wadhwa Group
L&T Realty
Transcon Developers and Sheth Creators
Cooperative Group Housing Society (CGHS)
Atmiya
Group
Source: Magicbricks Research
20,000
20,500
21,000
21,500
22,000
22,500
23,000
23,500
24,000
24,500
25,000
25,500
26,000
Q1 23 Q2 23 Q3 23 Q4 23 Q1 23
Average Rate (INR
psf)
18,000
18,500
19,000
19,500
20,000
20,500
21,000
21,500
22,000
22,500
23,000
23,500
24,000
24,500
25,000
Q1 23 Q2 23 Q3 23 Q4 23 Q1 24
Average Rate (INR
psf)
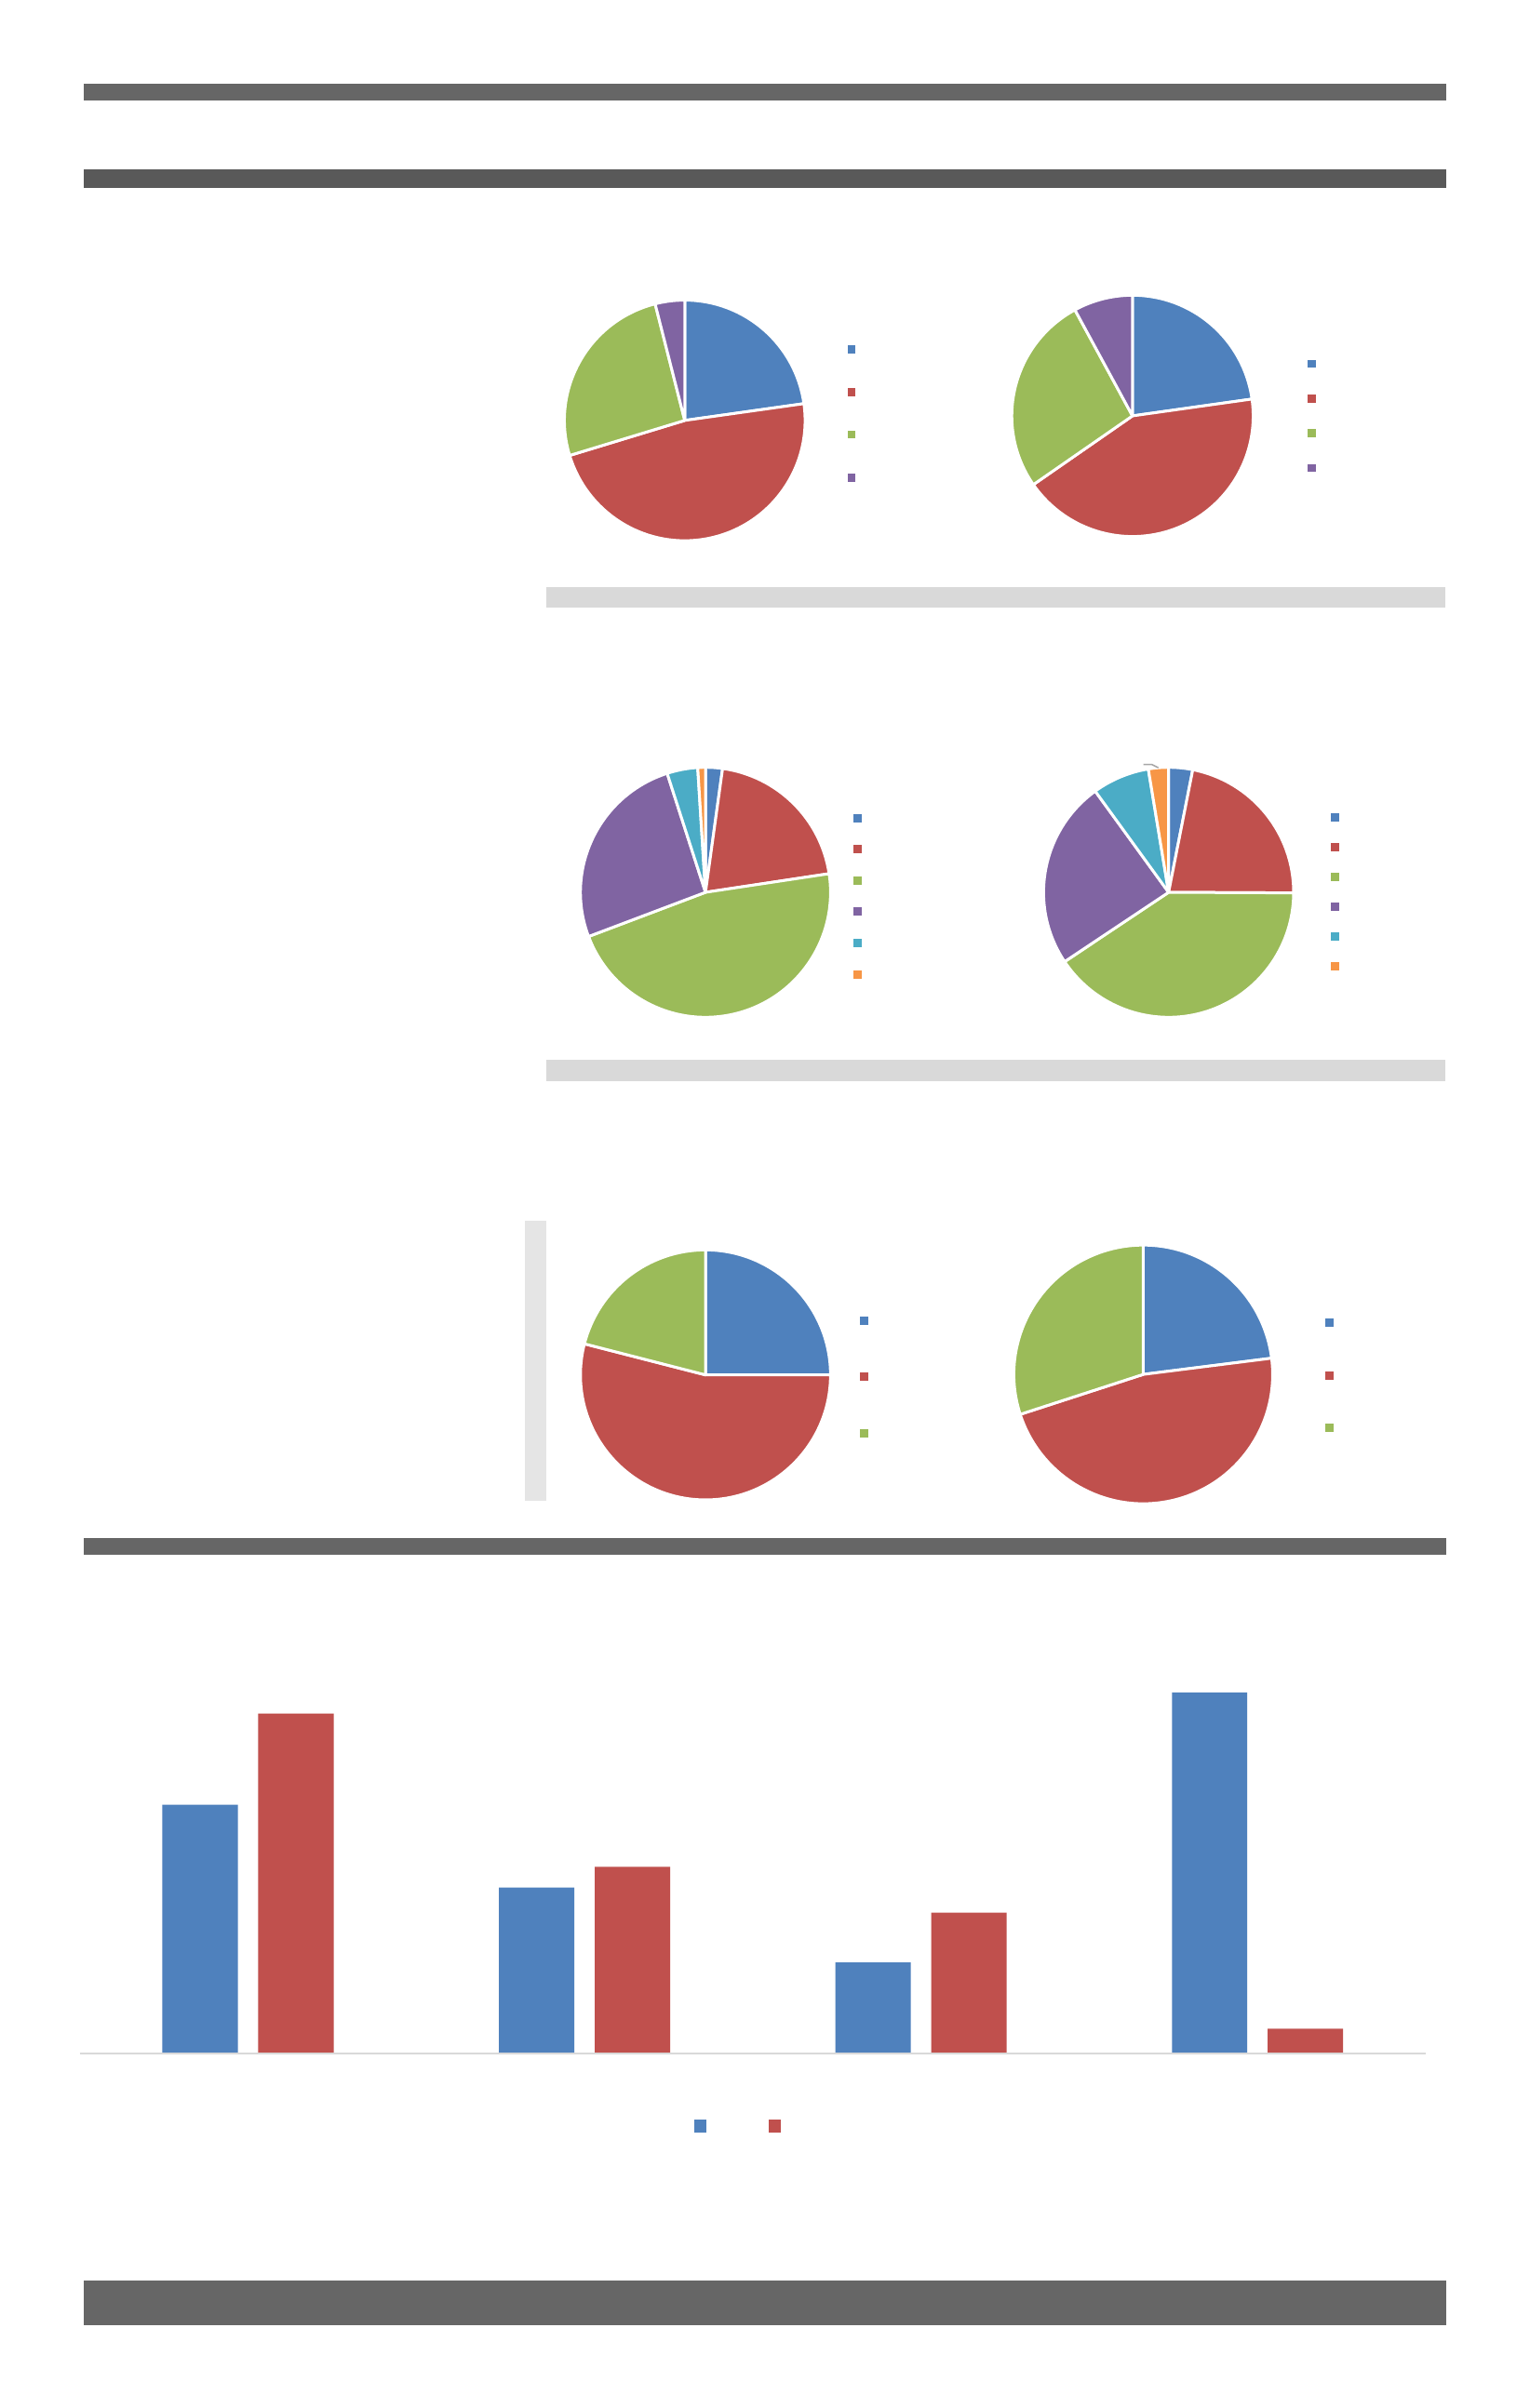
2%
21%
47%
26%
4%
1%
Below 500
500-750
750-1,250
1,250-2,000
2,000-3,000
Above 3,000
Supply by Size
Demand by Size
3%
22%
41%
24%
7%
3%
Below 500
500-750
750-1,250
1,250-2,000
2,000-3,000
Above 3,000
Demand-Supply Analysis Mumbai |JAN-MAR 2024
© m agicbricks .com
Page 3
Looking at the quarterly as well as yearly changes, all housing configurations demonstrated growth in rate (INR psf). 1 BHKs showed maximum
growth, across both QoQ and YoY. Compared to larger units, compact units showed higher growth in rate. This suggests a preference among
homebuyers for compact residences amid rising prices and inflation.
BHK wise Average Rate Change (INR psf)
2 BHKs top the charts
across both demand and
supply trends
The demand patterns observed in Mumbai
reveal a clear preference for 2-bedroom, hall,
kitchen (2 BHK) units, which dominate the
market with a significant share of 48%.
Moreover, an in-depth analysis shows that
nearly half of the prospective homebuyers in
Mumbai are inclined towards mid-segment
apartments.
These properties, falling within the area
range of 750 to 1,250 square feet, emerge as
the most coveted categories, capturing 47%
of the total demand. Interestingly, this
demand outstrips the supply share of similar
properties, which stands at 41%.
In Mumbai, homebuyers
searched for mid range
units
The real estate market in Mumbai
demonstrates a strong preference for
properties priced between INR 15,000 to
25,000 psf. This pricing trend highlights the
significant demand from individuals seeking
properties in the mid to high segments of the
market. This indicates a prevalent preference
among buyers for properties that offer
certain amenities or locations associated with
this price range, reflecting the specific tastes
and priorities of Mumbai's property seekers.
23%
48%
26%
4%
1 BHK
2 BHK
3 BHK
Above 3 BHK
23%
43%
27%
8%
1 BHK
2 BHK
3 BHK
Above 3 BHK
Demand by BHK Supply by BHK
Mid segment homes ranging from 750 to 1,250 sf witnessed highest
traction
25%
54%
21%
<15,000
15,000-25,000
>25,000
23%
47%
30%
<15,000
15,000-25,000
>25,000
Demand by Rates Supply by Rates
Highest demand and supply for properties priced between INR 15,000-
25,000 psf
Source: Magicbricks Research
6.0%
4.0%
2.2%
8.7%
8.2%
4.5%
3.4%
0.6%
1 BHK 2 BHK 3 BHK Above 3 BHK
QoQ YoY
Area in sf Area in sf
Rate in INR psf Rate in INR psf
Rate Analysis
© m agicbricks .com
Page 4
Mumbai |JAN-MAR 2024
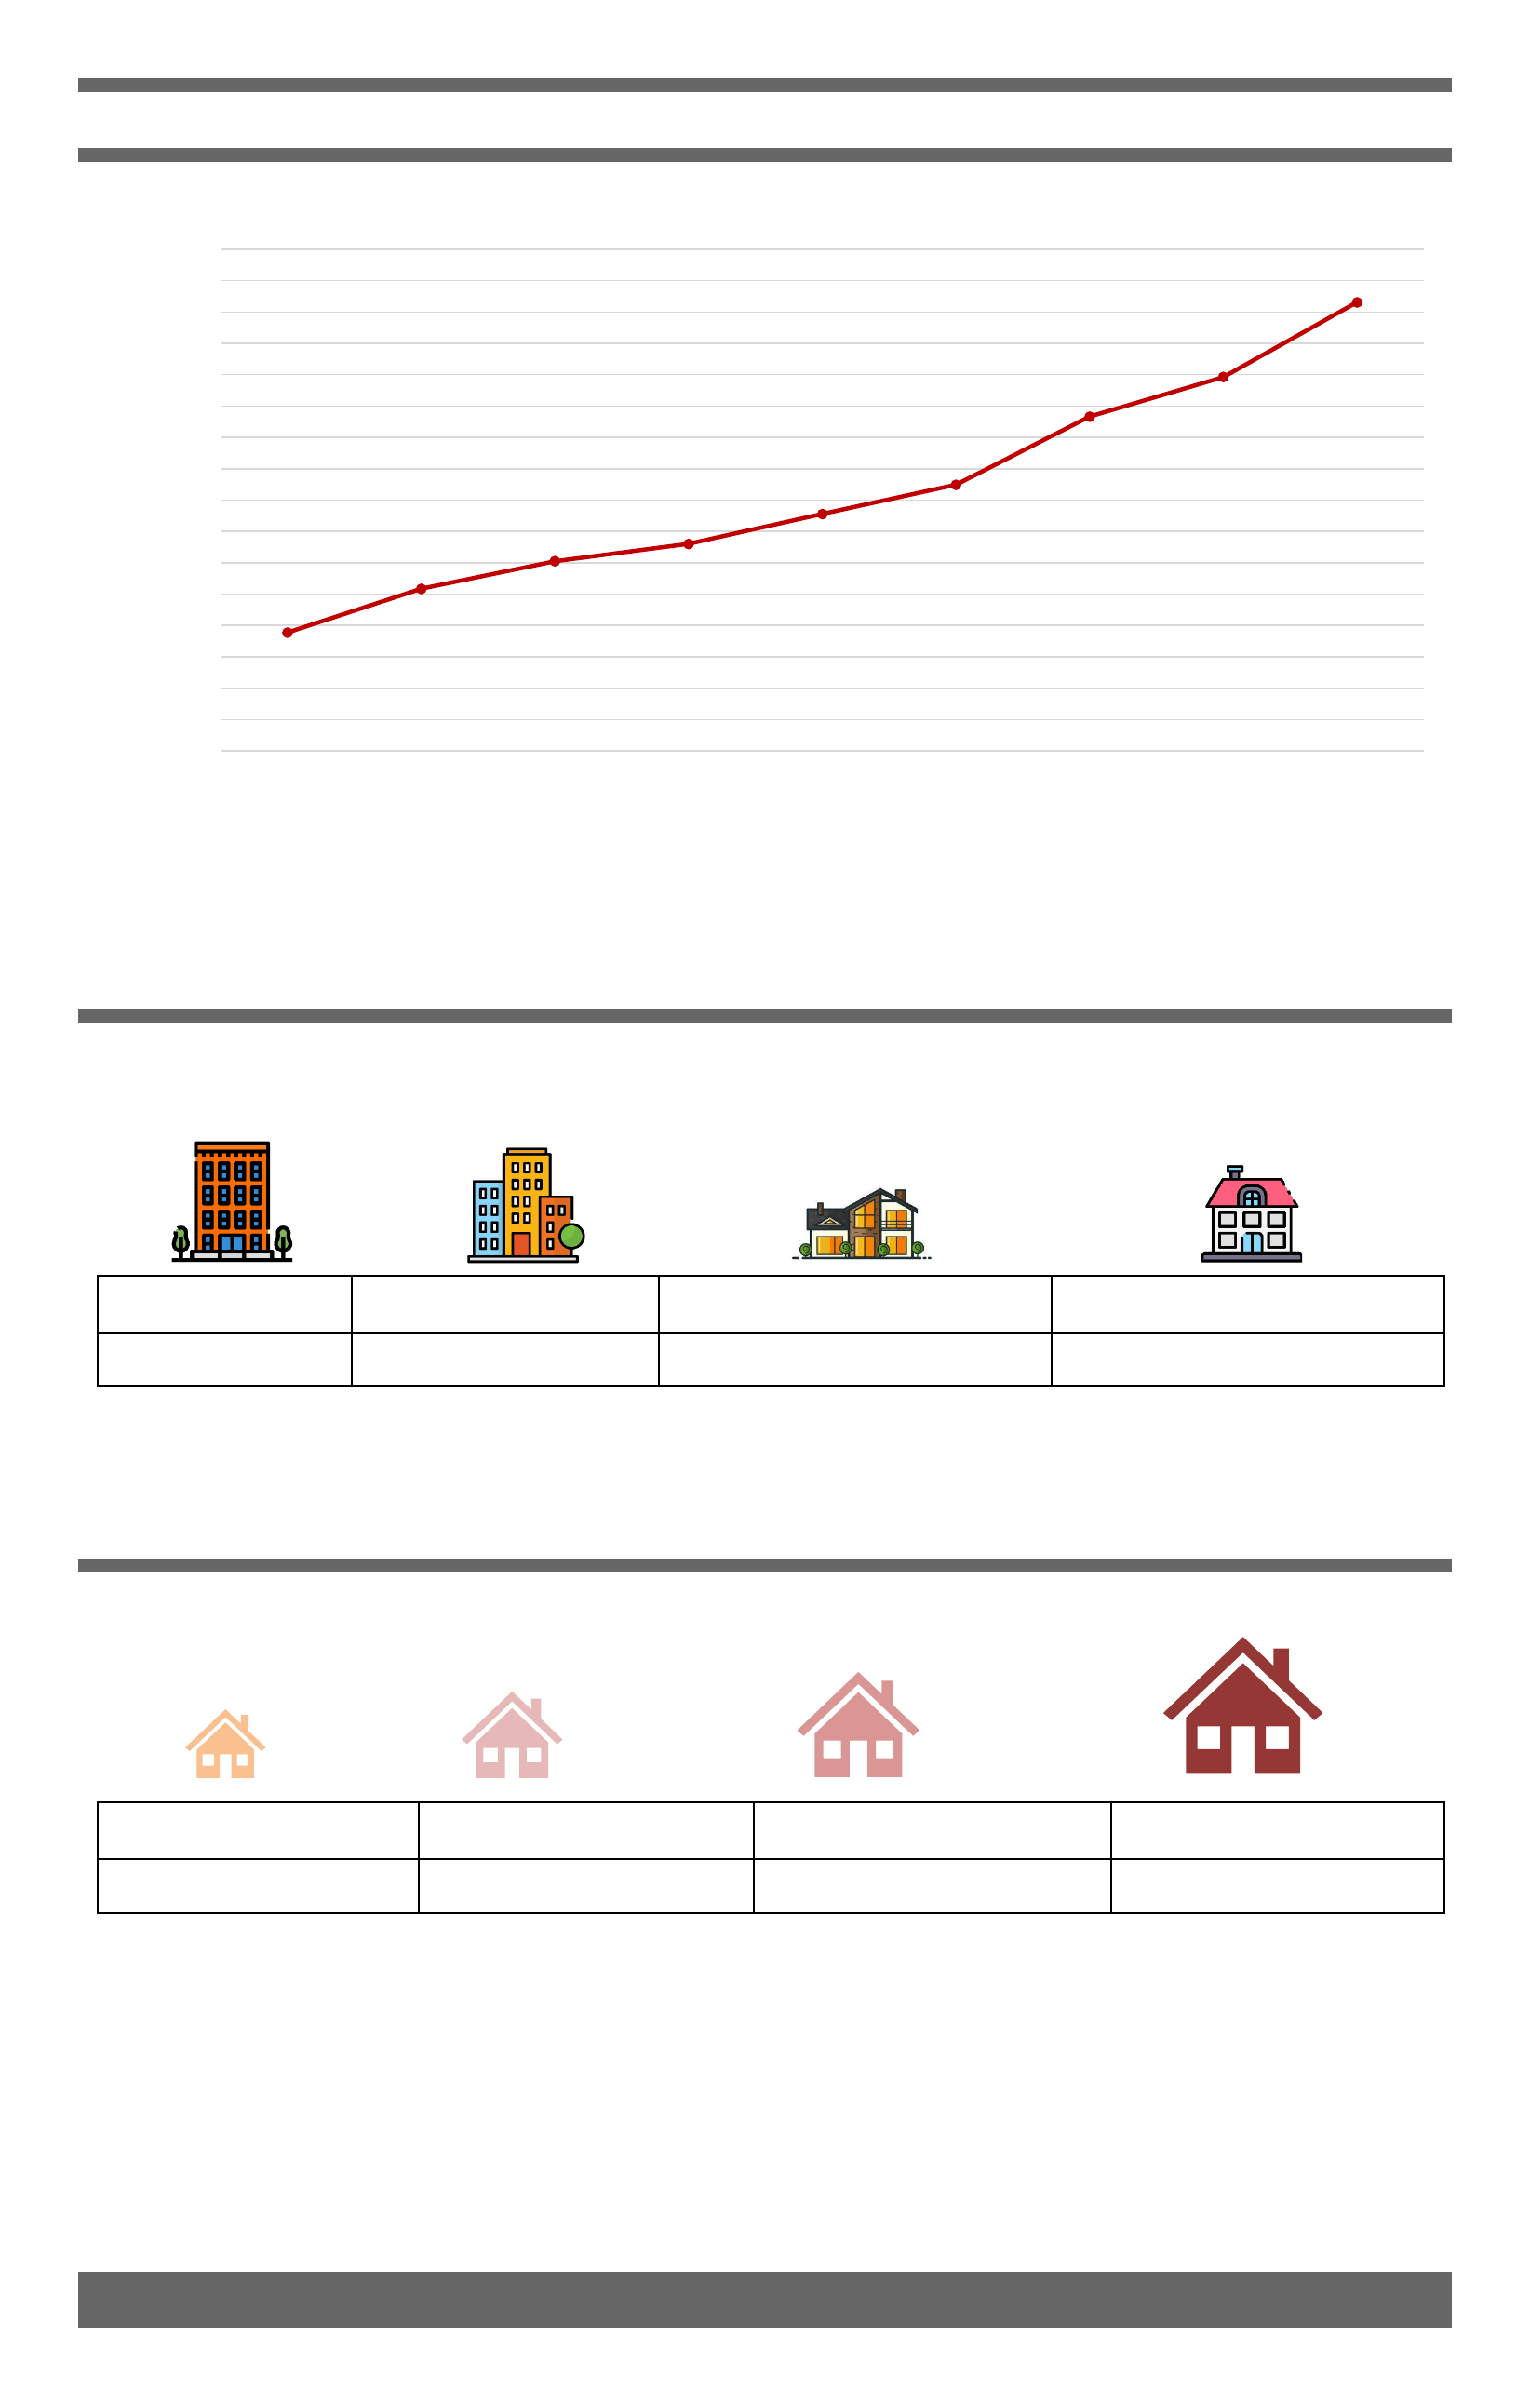
QoQ Change In Average Rate (INR psf)
Average Rates (Property Type)
Builder Floor Multistorey Apartment Residential House Villa
10,300 29,600 35,000 42,000
In Mumbai, the real estate market has diverse pricing as builder floors command an average rate of INR 10,300 psf,
multistorey apartments stand at INR 29,600 psf, residential houses at INR 35,000 psf, and luxurious villas are available at a
whopping price of INR 42,000 psf on the cover area.
Due to sustained and robust demand, there has been a consistent upward trajectory in property prices across Mumbai.
Over the span of the last eight quarters, there has been a noteworthy increase in average property rates, showing a steady
growth of approximately 25%. Specifically, from the first quarter of 2022 to the first quarter of 2024, the average price per
square foot surged from INR 19,886 to INR 25,153, reflecting the enduring strength of the real estate market in the city.
Source: Magicbricks Research
Average rates (BHK wise)
In Mumbai, residential properties exhibit a diverse pricing spectrum, ranging from INR 8,000 to 45,000 psf, encompassing
various configurations and typologies. The average rate for 1 BHK residences stands at INR 15,800 psf, while luxury
segments, particularly 3 BHK and above, command an average rate of INR 36,400 psf on the cover area.
1 BHK 2 BHK 3 BHK Above 3 BHK
15,800 20,900 27,700 36,400
19,886
20,583
21,024
21,299
21,776
22,243
23,329
23,961
25,153
18,000
18,500
19,000
19,500
20,000
20,500
21,000
21,500
22,000
22,500
23,000
23,500
24,000
24,500
25,000
25,500
26,000
Q1 2022 Q2 2022 Q3 2022 Q4 2022 Q1 2023 Q2 2023 Q3 2023 Q4 2023 Q1 2024
Rate (INR
psf)

Micro-Market Statistics Mumbai |JAN-MAR 2024
© m agicbricks .com
Page 5
Top Micro-markets in the City
The western suburbs of Mumbai continue to be the top choice for homebuyers due to their outstanding connectivity to
employment centers and enhanced social and commercial amenities. This trend is underscored by recent data spanning across
four quarters, highlighting neighbourhoods like Malad-Kandivali, which continue to be the leading choices for homebuyers,
alongside other areas such as Andheri East-Jogeshwari East and Borivali-Dahisar. This preference can be linked to their close
proximity to business districts, well-developed retail infrastructure, the presence of Chhatrapati Shivaji Maharaj International
Airport, and excellent access to the Western Express Highway.
Inference
Micro-Markets with Highest Demand Micro-Markets with Highest Supply
Micro
-market Avg. Rate Rank Q1-
24
Rank Q4-
23
Malad
-Kandivali 18,300 1 1
Andheri East
-
Jogeshwari East
19,700 2 5
Andheri West
-
Jogeshwari West
25,400 3 3
Goregaon
20,200 4 6
Borivali
-Dahisar 20,400 5 4
Kurla
-Ghatkopar 19,900 6 2
BKC
29,300 7 7
Bandra West
-Linking
Road
40,700 8 -
Micro
-market Avg. Rate Rank Q1-
24
Rank Q4-
23
Malad
-Kandivali 18,300 1 1
Borivali
-Dahisar 20,400 2 3
Andheri West
-
Jogeshwari West
25,400 3 4
Goregaon
20,200 4 2
Andheri East
-
Jogeshwari East
19,700 5 5
Worli
-Lower Parel 45,100 6 -
Mulund
19,800 7 8
Kurla
-Ghatkopar 19,900 8 7
Notes:
1. Top micro-markets ranked by number of searches on Magicbricks in Q1 2024.
2. Average rate in the micro-market in INR psf.
Notes:
1. Top micro-markets ranked by their active listings on Magicbricks in Q1 2024.
2.Average rate in the micro-market in INR psf.
Note: Map above represents the top preferred micro-markets in the city in Q1 2024. Source: Magicbricks Research
Source: Magicbricks Research
Beyond Mira Rd
Malad-Kandivali
Andheri-Jogeshwari (E)
Goregaon
Andheri-Jogeshwari (W)
BKC
Worli-Lower Parel
Note: This map is not to scale.
Bandra-Worli Sealink
ARABIAN SEA
NAVI
MUMBAI
THANE
Borivali-Dahisar
Kurla Ghatkopar
Mulund
