
Quarterly Real Estate Analysis for MUMBAI
Insite
Price Trends
Growth Drivers
Supply Analysis
October - December 2015

99acres Insite
2 3
Navi Mumbai outperforms other zones;
investors pin hopes on
NAINA
City Insite Report
Oct - Dec 2015
Mumbai
0%
Content
City-Highlights:
Price Trend Analysis:
MMR- Central Suburbs, Andheri-Dahisar,
Harbour, South and South West
Navi Mumbai
Thane and Beyond
Supply Analysis:
06
07
08
09
10
Capital Growth
INTRODUCTION
The 99acres.com Mumbai Insite report brings to you
major movements in the real estate market of the city,
in Oct-Nov-Dec 2015 as compared to Jul-Aug-Sep 2015.
The report not only captures the significant trends across
various localities in Mumbai, but also brings to you
the analysis and the insights that will make this report
valuable for investors and end users. The report also
includes an in-depth supply analysis to enable sellers
and buyers determine the direction of the market.
Methodology
We have reported quarterly price movement of capital and
rental values measured in per square feet for the analysis
of Mumbai’s residential market. Effort has been made to
provide comparable and accurate city level data, since
prices and rents are floating and at any point may vary
from the actual numbers.
Kalyan
Navi Mumbai
Kalyan
Navi Mumbai
Kalyan
Navi Mumbai
MMR
0%
Thane
0%
Navi Mumbai
2%
99acres Insite
4 5
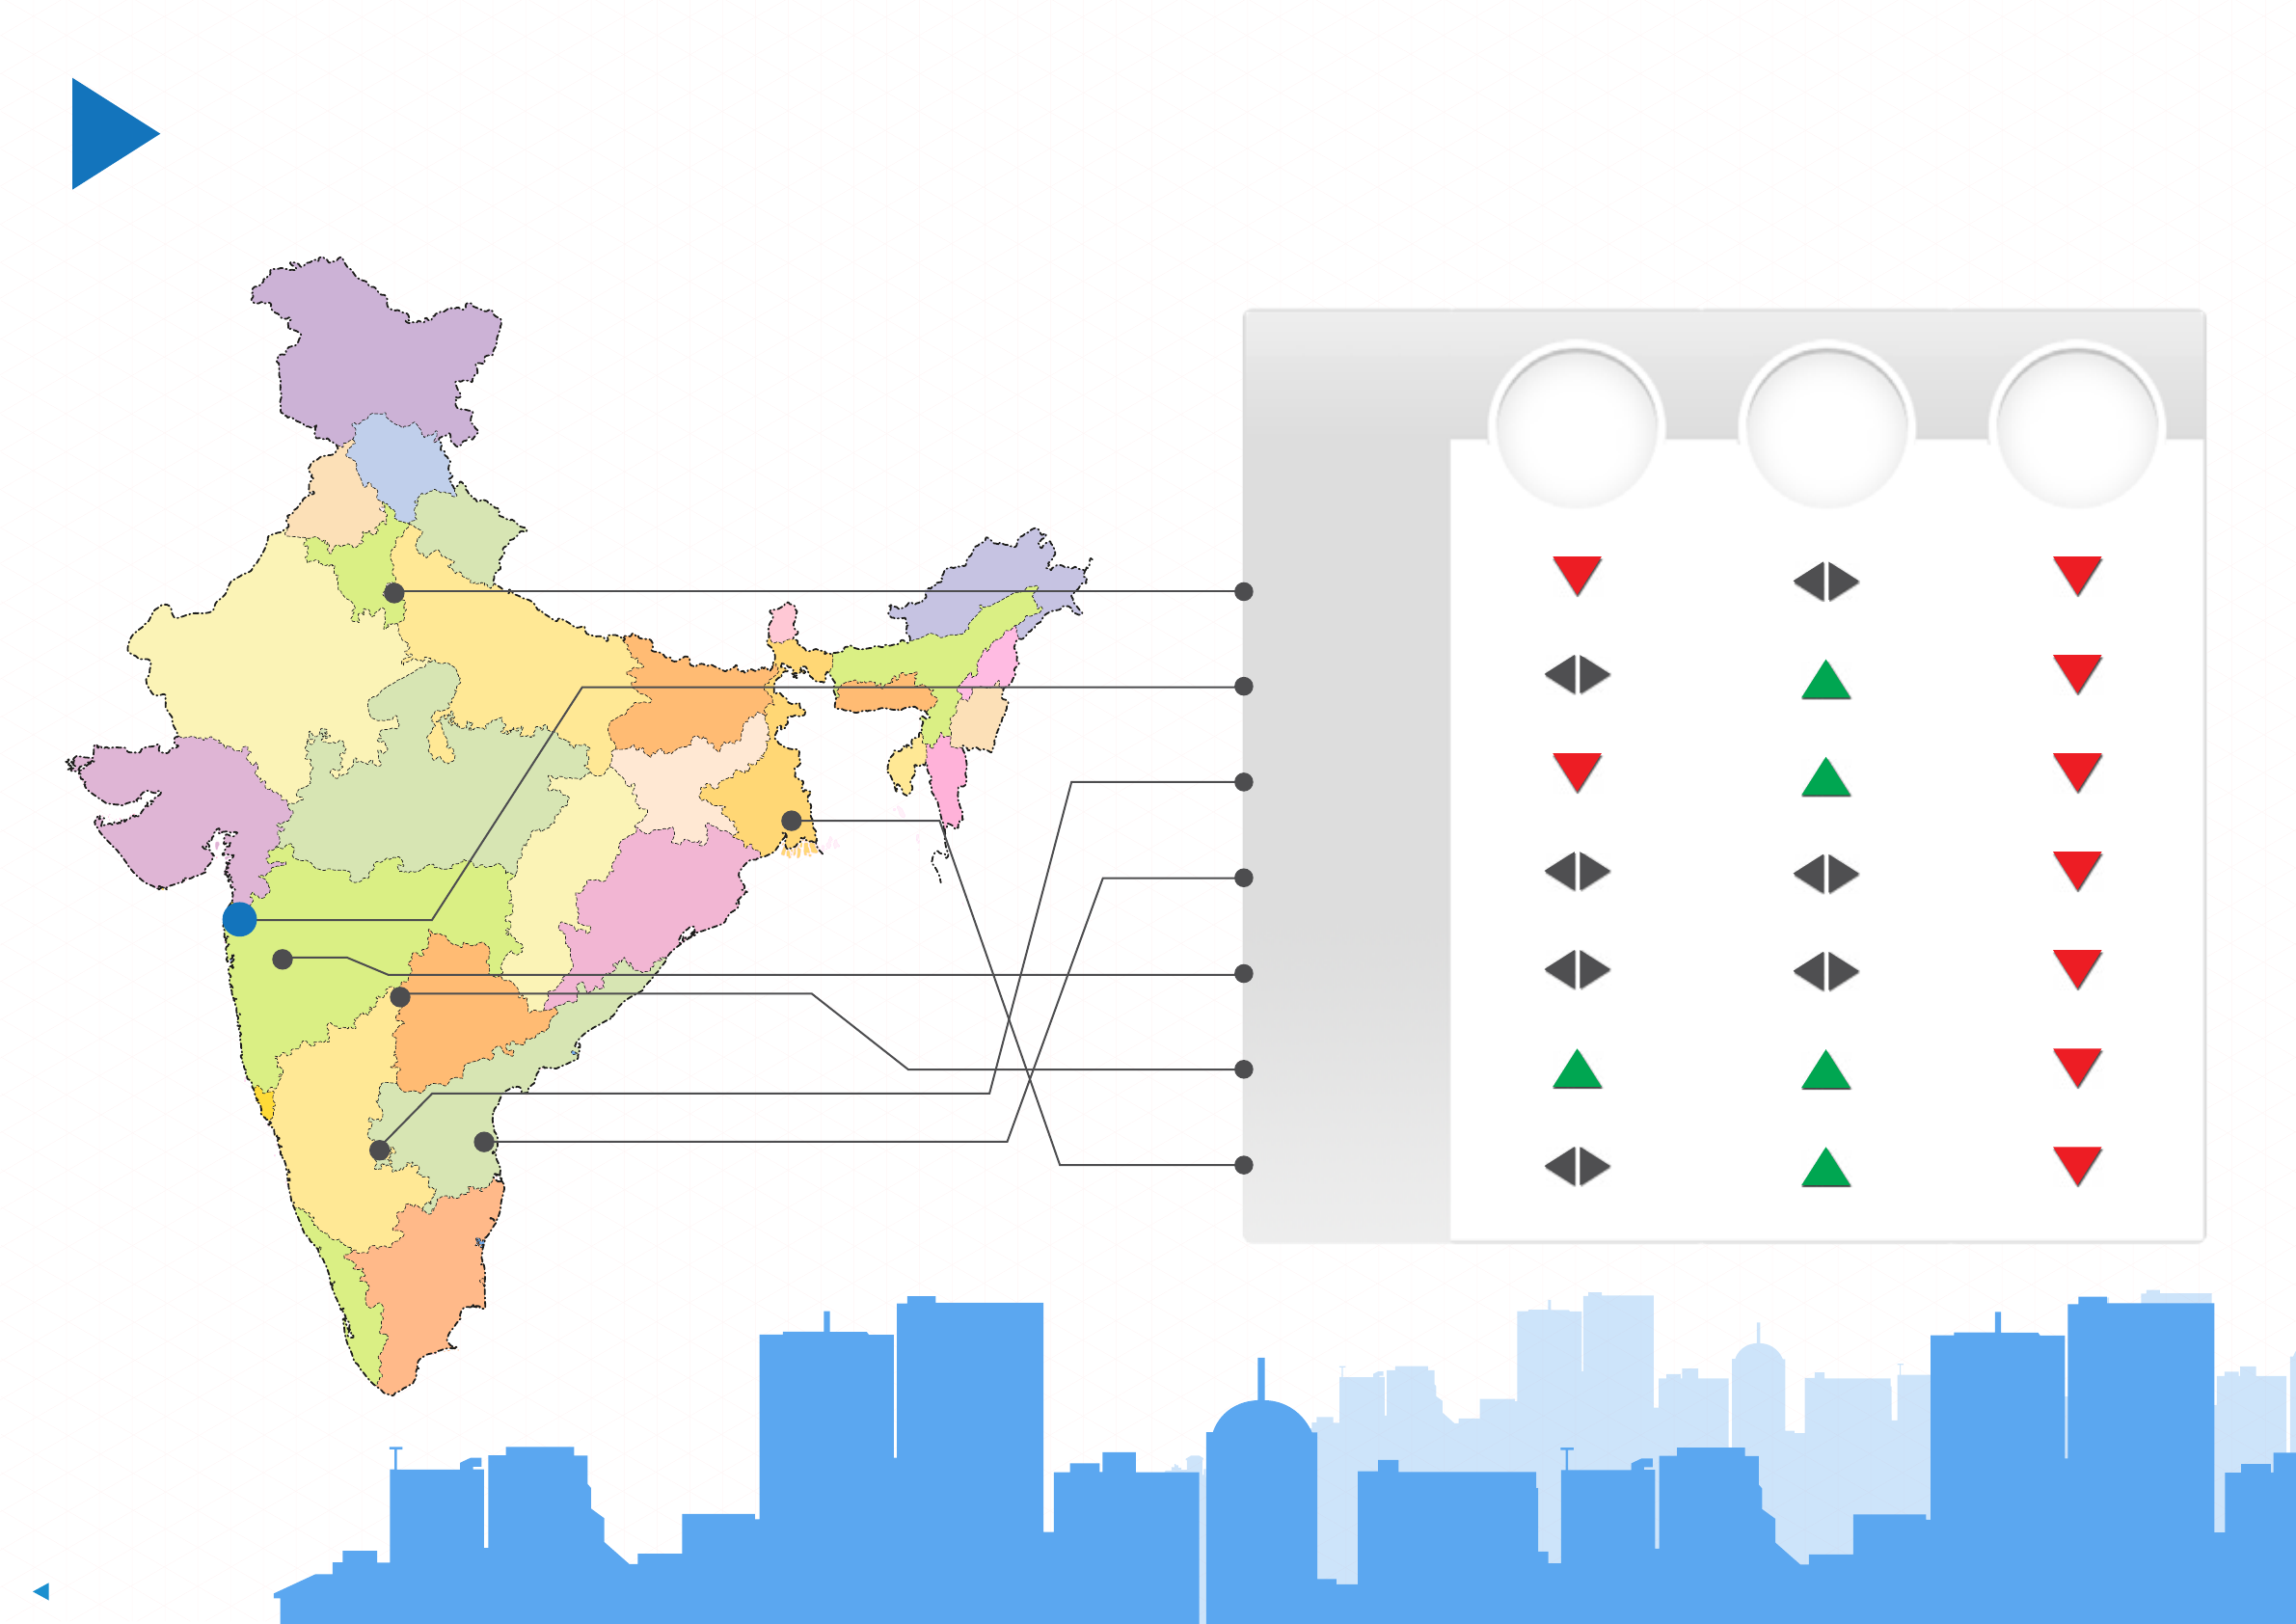
Realty Round-up
Delhi NCR
Mumbai
Bangalore
Hyderabad
Kolkata
Chennai
Pune
Capital
Values
Delhi NCR
Mumbai
Bangalore
Chennai
Pune
Hyderabad
Kolkata
Rental
Values
Supply
* Capital values represent quarterly change
* Rental values represent yearly change
* Supply is basis properties listed on 99acres.com

99acres Insite
6 7
MUMBAI
City Highlights
Mumbai Metropolitan Region (MMR) - (Central Suburbs, Andheri-Dahisar, Harbour,
South & South West Mumbai, Mira Road & beyond)
Capital Analysis
Despite announcements of several road and metro projects, Mumbai’s property market plateaued
under the weight of rising construction costs, demand-supply mismatch and snail-paced infrastructural
growth. While keeping buyers at bay, these factors impelled the realty graph of the financial capital to
dip insignificantly from the Jul-Sep quarter to Oct-Dec 2015.
• With the exception of the south west localities, the
property landscape of the Mumbai Metropolitan Region
(MMR) has delineated a downturn, as a result of lofty
price tags.
• Navi Mumbai added yet another feather to its cap with
the City and Industrial Development Corporation (CIDCO)
launching Maharashtra’s first smart city project.
• The frequent policy changes in Thane’s real estate
market and habitual stonewalling of core stakeholders
when drafting vital industry guidelines, dampened
developers’ sentiments.
• Focussed on improving the metro connectivity in
the region, the Maharashtra government announced
completion of the Seepz-Kanjur Marg line by 2018, the
Andheri (E)-Dahisar (E) and Dahisar-DN Nagar lines by
2019, and the Colaba-Bandra-SEEPZ stretch by 2022.
• In addition, the highway infrastructure is set to receive a
massive fillip with the state government planning to pump
Rs 28,000 crore in 21 projects spanning 1,500 km, in 2016.
• Taking a colossal step towards promoting real estate
transparency, the state government would grant new
building permissions and conduct concurrent audits via
e-platform starting January 2, 2016.
• In lieu of slashing property prices, developers condensed
apartment sizes to maintain affordability. Flat sizes in
the city have been reduced by 26.4 per cent between
2010 and 2015.
*The graph represents Q-o-Q change in average capital values in Mumbai
Rental Analysis
• The downhill trajectory from a trifling growth of one per
cent in Jul-Sep 2015, to stagnancy in Oct-Dec 2015, is
attributed to the prodigious gap between a household’s
average annual income in Mumbai (around Rs 7.5 lakh per
annum) and the price of inventory in MMR (Rs 1 crore
and above).
• Vasai Road, a locality beyond Mira Road, saw capital
values clocking a surge of 10 per cent in Oct-Dec 2015, the
highest in MMR. The locality’s growth is being attributed to
the possibility of enhancement in rail infrastructure.
• Vasai Road was followed by another locality beyond
Mira Road, Boisar; and Kanjur Marg (West) in Central
Mumbai suburbs, each of which recorded an average
rise of eight per cent.
• The peripheral industrial town of Boisar enjoyed the
advantage of being a low-cost area. The locality offers
affordable housing inventory from reputed builders.
Properties here are priced around Rs 3,500 per sq ft, vis-à-
vis the five digit price tags in the central locales of Mumbai.
• Kanjur Marg (West) owes its escalating values to the recent
improvement in rail infrastructure and the Mumbai Metro
Rail Corporation (MMRC) prioritising Seepz-Kanjur Marg
Metro corridor.
• Anticipation of a 40 km metro route, connecting Wadala-
Ghatkopar-Thane-Kasarvadavali, infused cheer in Wadala.
However, the persistent delay in infra development led to
the realty graph plummeting by three per cent this quarter.
• The residential rental landscape of MMR had a
successful story to narrate. The average values climbed
by a notable margin of four per cent in Oct-Dec 2015, as
compared to the same quarter in 2014.
• Sakinaka in Andheri East clocked an enormous rise of
17 per cent in rental values, year-on-year, on the back
of metro connectivity. In fact, the Andheri to Sakinaka
metro corridor is one of the most popular routes, which
witnesses an average of over 25,500 commuters per day.
• One of the biggest employment generating locales of
Mumbai, Lower Parel, followed Sakinaka closely, with
a rental appreciation of 16 per cent in the same time
frame. Even capital sentiments in this locality have
lifted due to the Brihanmumbai Municipal Corporation’s
(BMC) endeavour to transform the area into a
smart city.
• Jogeshwari (West), where average rental values in
the last one year escalated to the tune of 14 per cent,
had the connecting bridge between the locale and
Goregaon (East) to thank, which eased traffic flow
greatly and reduced bottlenecks at peak commutation
hours between the east-west regions.
• Rental rates in Chandivali and Powai in the Central
Mumbai suburbs witnessed a decent jump of 12 per
cent between Oct-Dec 2014 and 2015. The growth in
values is attributed to the excellent connectivity to the
east-west suburbs facilitated by the Jogeshwari-Vikhroli
Link Road (JVLR) and the LBS Marg.
Top Performers in MMR (Capital Values)
Top Performers in MMR (Rental Values)
• Competitive rental rates have steered IT firms towards
Navi Mumbai, leaving MMR to be dominated by the
banking, financial services and insurance (BFSI) sector.
In fact, over 75 per cent of Navi Mumbai‘s office
landscape is occupied by IT/ITeS firms.
*Rental values represent yearly change
2%
Jan-Mar’15
Apr-Jun’15
Jul-Sep’15
Oct-Dec’15
1%
0%
1%
KEY INFLUENCERS
Upcoming Navi
Mumbai Airport
Inuence Notied Area
(NAINA)
Demand supply
mismatch in the MMR
Launch of CIDCO’s
smart city project in
Navi Mumbai
Launch of premium
residential projects in
Thane
Bhandup (West)
Powai
Raheja Vihar
Chandivali
Marol
Kanjur Marg (East)
Jogeshwari
(West)
Sakinaka
17%
10%
10%
10%
11%
11%
12%
14%
Lower Parel
16%
Q-o-Q Price Index
Bandra (West)
Charkop
Pali Hill
Byculla
Chembur
(East)
Hiranandani
Gardens - Powai
Vikhroli
(East)
Boisar
Vasai Road
10%
4%
4%
5%
5%
6%
7%
7%
8%
Kanjur Marg
(West)
8%
Kanjur Marg (West)
9%

99acres Insite
8 9
Navi Mumbai Thane & Beyond
Capital Analysis Capital Analysis
Rental Analysis Rental Analysis
• Replicating last quarter’s growth trajectory, the real estate
landscape of Navi Mumbai offered some breather after the
grimness elucidated by MMR. The market clocked a
growth of two per cent in Oct-Dec 2015, vis-à-vis the
preceding quarter.
• In addition to the ongoing Navi Mumbai Airport Influence
Notified Area (NAINA), the city has another achievement to
boast – CIDCO’s smart city project. Maharashtra is slated to
witness its first smart city situated in Navi Mumbai by 2019,
for which the agency has proposed a total investment of
Rs 34,777 crore.
• Although the Navi Mumbai International Airport continues
to remain embroiled in legal controversies with the forest
department at Alibag, it has definitely proffered hope to
the micro-markets of Ulwe, Kharghar and Kamothe. These
localities recorded a spike in average capital values by four
per cent, three per cent and one per cent, respectively.
• Sharing a similar fate as that of the airport, the Navi
Mumbai metro project also features in the list of delayed
and controversial infrastructure projects in Mumbai.
However, this project has sustained realty sentiments in
Kharghar and Taloja, which recorded a growth of four per
cent between the last two quaters of 2015.
• Average capital values in Sector-36, Kharghar, which
houses CIDCO’s affordable residential project under the
Swapnapurti Scheme, plunged by five per cent quarterly.
Despite targeting the Economically Weaker Sections (EWS)
and Low Income Groups (LIG), the agency offered units
at Rs 5,124 per sq ft, which is approximately same as the
ongoing market price (Rs 4,500 - Rs 5,500 per sq ft).
• Despite a slew of infrastructure improvements such as
Wadala-Ghatkopar-Thane metro corridor, Thane’s property
landscape emulated MMR’s story and remained stagnant
in Oct-Dec 2015, after clocking a minimal growth in the
Jul-Sep quarter last year.
• Patlipada’s real estate grew from three per cent in the
previous quarter to six per cent in Oct-Dec 2015. Its
proximity to Hiranandani Estate proves to be an
advantage for the locality.
• Although it continued to hold its position in the
list of top performers in Thane, Kapurbawdi’s capital
sentiments flagged from seven per cent in
Jul-Sep 2015 to five per cent in Oct-Dec 2015.
Bhiwandi and Kolshet Road, too, witnessed property
prices rising by the same margin.
• Kapurbawadi owes its growth to its strategic location and
a number of big ticket projects in the vicinity. Situated at
a convergence from which roads lead to Pokhran Road No.
2, Majiwada registered an average capital rise of three per
cent in Oct-Dec 2015 vs. the preceding quarter.
• Replicating Kapurbawadi’s claim to fame, Bhiwandi, too,
is home to several new project launches, resulting in an
average capital appreciation of five per cent in Oct-Dec as
against the quarter ending September 2015.
• Builder sentiments in Thane were dulled by the frequent
alterations in housing policies. The fraternity complained
of stakeholders being kept in the dark during the
formulation of vital industry guidelines. To this end,
builders sought a digitised process for project approvals.
• A year-on-year study revealed that Navi Mumbai’s rental
market witnessed an unanticipated growth of seven per
cent in Oct-Dec 2015 over the same quarter last year.
A substantial extent of credit for this surge goes to the
presence of IT/ITeS firms, which were instrumental in
attracting workforce, thus increasing demand for
houses on rent.
• Boasting of a rise of 20 per cent, New Panvel contributed
significantly to the landscape’s growth. However, the
surge does not come as a surprise since the region has
strong civic infrastructure and is well-connected to
Mumbai and other parts of the state via a network of
roads, namely, the Mumbai-Pune Expressway and the
Uran-Panvel Road. Since the area is located at an easy
distance of 11 km from the Navi Mumbai Airport, it will
continue being one of the preferred localities of the
tenant community in the city.
• Ulwe recorded a jump of 17 per cent in rental values in
Oct-Dec 2015, vis-à-vis 2014. With the state government
of Maharashtra adopting the ‘Housing for All’ scheme
and aiming to build 19 lakh low-priced houses by 2022,
the comparatively affordable market of Ulwe has come
to the fore. Reasonably-priced properties translate into
lower rentals. The locality is expected to see better
times ahead with the development of three special
economic zones (SEZ) by Reliance Industries.
• Belapur witnessed a rental growth of 16 per cent in
the last one year. The broadening of the Sion-Panvel
Expressway from four to six lanes helped the locality to
become popular among the tenant community.
• Maintaining its growth pace on the rental charts,
Thane clocked an average rise of four per cent
between Oct-Dec 2014 and 2015. The state
government’s endeavour to improve road and
civic infrastructure in the region, coupled with the
affordability quotient, sustained sentiments.
• Anand Nagar’s rental landscape witnessed a
remarkable hike of 10 per cent in Oct-Dec 2015,
vis-à-vis the same quarter last year. The locality
owns its rental demand to its strategic location at
a cross junction road, which facilitates quick travel
to Kolshet Road via the locality. Furthermore, the
Thane Municipal Corporation proposed the
construction of a foot overbridge along the
Eastern Express Highway to ease travel for
cyclists and pedestrians.
• Rents in Pokharan Road recorded a rental hike of 10
per cent in the last one year. The long-pending issue
of broadening Pokharan Road No.1, which will ease
bottlenecks at Vartak Nagar junctions, has added to
the rental flavour of the locality.
• Hiranandani Estate, which saw values escalating by
nine per cent during the tracked time span, draws its
demand from its excellent civic amenities, such as
clean roads and educational facilities. Being easily
accessible via the Ghodbunder Road and housing
the Hiranandani Business Park has proven
advantageous for the locality. Recently, Tata
Consultancy Services rented over two million sq ft
of office space for 15 years.
Top Performers in Navi Mumbai (Capital Values) Top Performers in Thane & Beyond (Capital Values)
Top Performers in Navi Mumbai (Rental Values)
Top Performers in Thane & Beyond (Rental Values)
*Rental values represent yearly change
*Rental values represent yearly change
10%
5%
4%
Seawoods
Nerul
Airoli
Ghansoli
Sanpada
Vashi
Belapur
Palm Beach
New Panvel
20%
5%
5%
5%
5%
8%
8%
16%
16%
Ulwe
17%
Waghbil
Hiranandani Meadows
Adharwadi
Vasant Vihar
Dombivli
(West)
Khopoli
Kolshet Road
Bhiwandi
Patlipada
6%
3%
4%
4%
4%
4%
5%
5%
Kapurbawadi
5%
Manpada
Waghbil
Kasarvadavali
Hiranandani Estate
5%
6%
6%
9%
Pokharan
Road
10%
Anand Nagar
12%
4%
Dronagiri
Airoli
Nerul
Kharghar
Taloja
Kalamboli
Ulwe
Karanjade
Sector 20,
Kamothe
9%
1%
2%
2%
3%
4%
4%
4%
5%
Vichumbe
8%
99acres Insite
10 11
Supply Analysis
While demand in the luxury and ultra-luxury segments continued to remain weak, surging land and
construction costs prevented builders from reducing prices within the MMR. Thanks to the state
government’s endeavour to improve connectivity between Mumbai and its peripheral regions and
low land costs, activity in the affordable segment heightened significantly in Navi Mumbai and
Thane in Oct-Dec 2015.
• As expected, the city which exemplifies vertical growth for
the country, saw residential apartments capturing all, save
three per cent of the market.
•
Boasting of several upcoming and proposed infrastructure
enhancements, Navi Mumbai strode ahead of the other
zones in bagging nearly one-third of the total supply
of apartments.
•
The Andheri-Dahisar region, too, witnessed a considerable
stock of flats; however, it was way behind Navi Mumbai,
capturing less than one-fifth of the total market supply.
•
Of the limited supply of builder floors, Thane had the
greatest bulk of this property type, appropriating a quarter
of the total supply in Oct-Dec 2015. Navi Mumbai, along
with Mira Road and areas beyond followed Thane closely
on its heels.
•
Occupying an insignificant share of the market,
independent houses/villas witnessed maximum takers in
regions beyond Thane. This property type was moderately
popular even in Andheri-Dahisar and Navi Mumbai too.
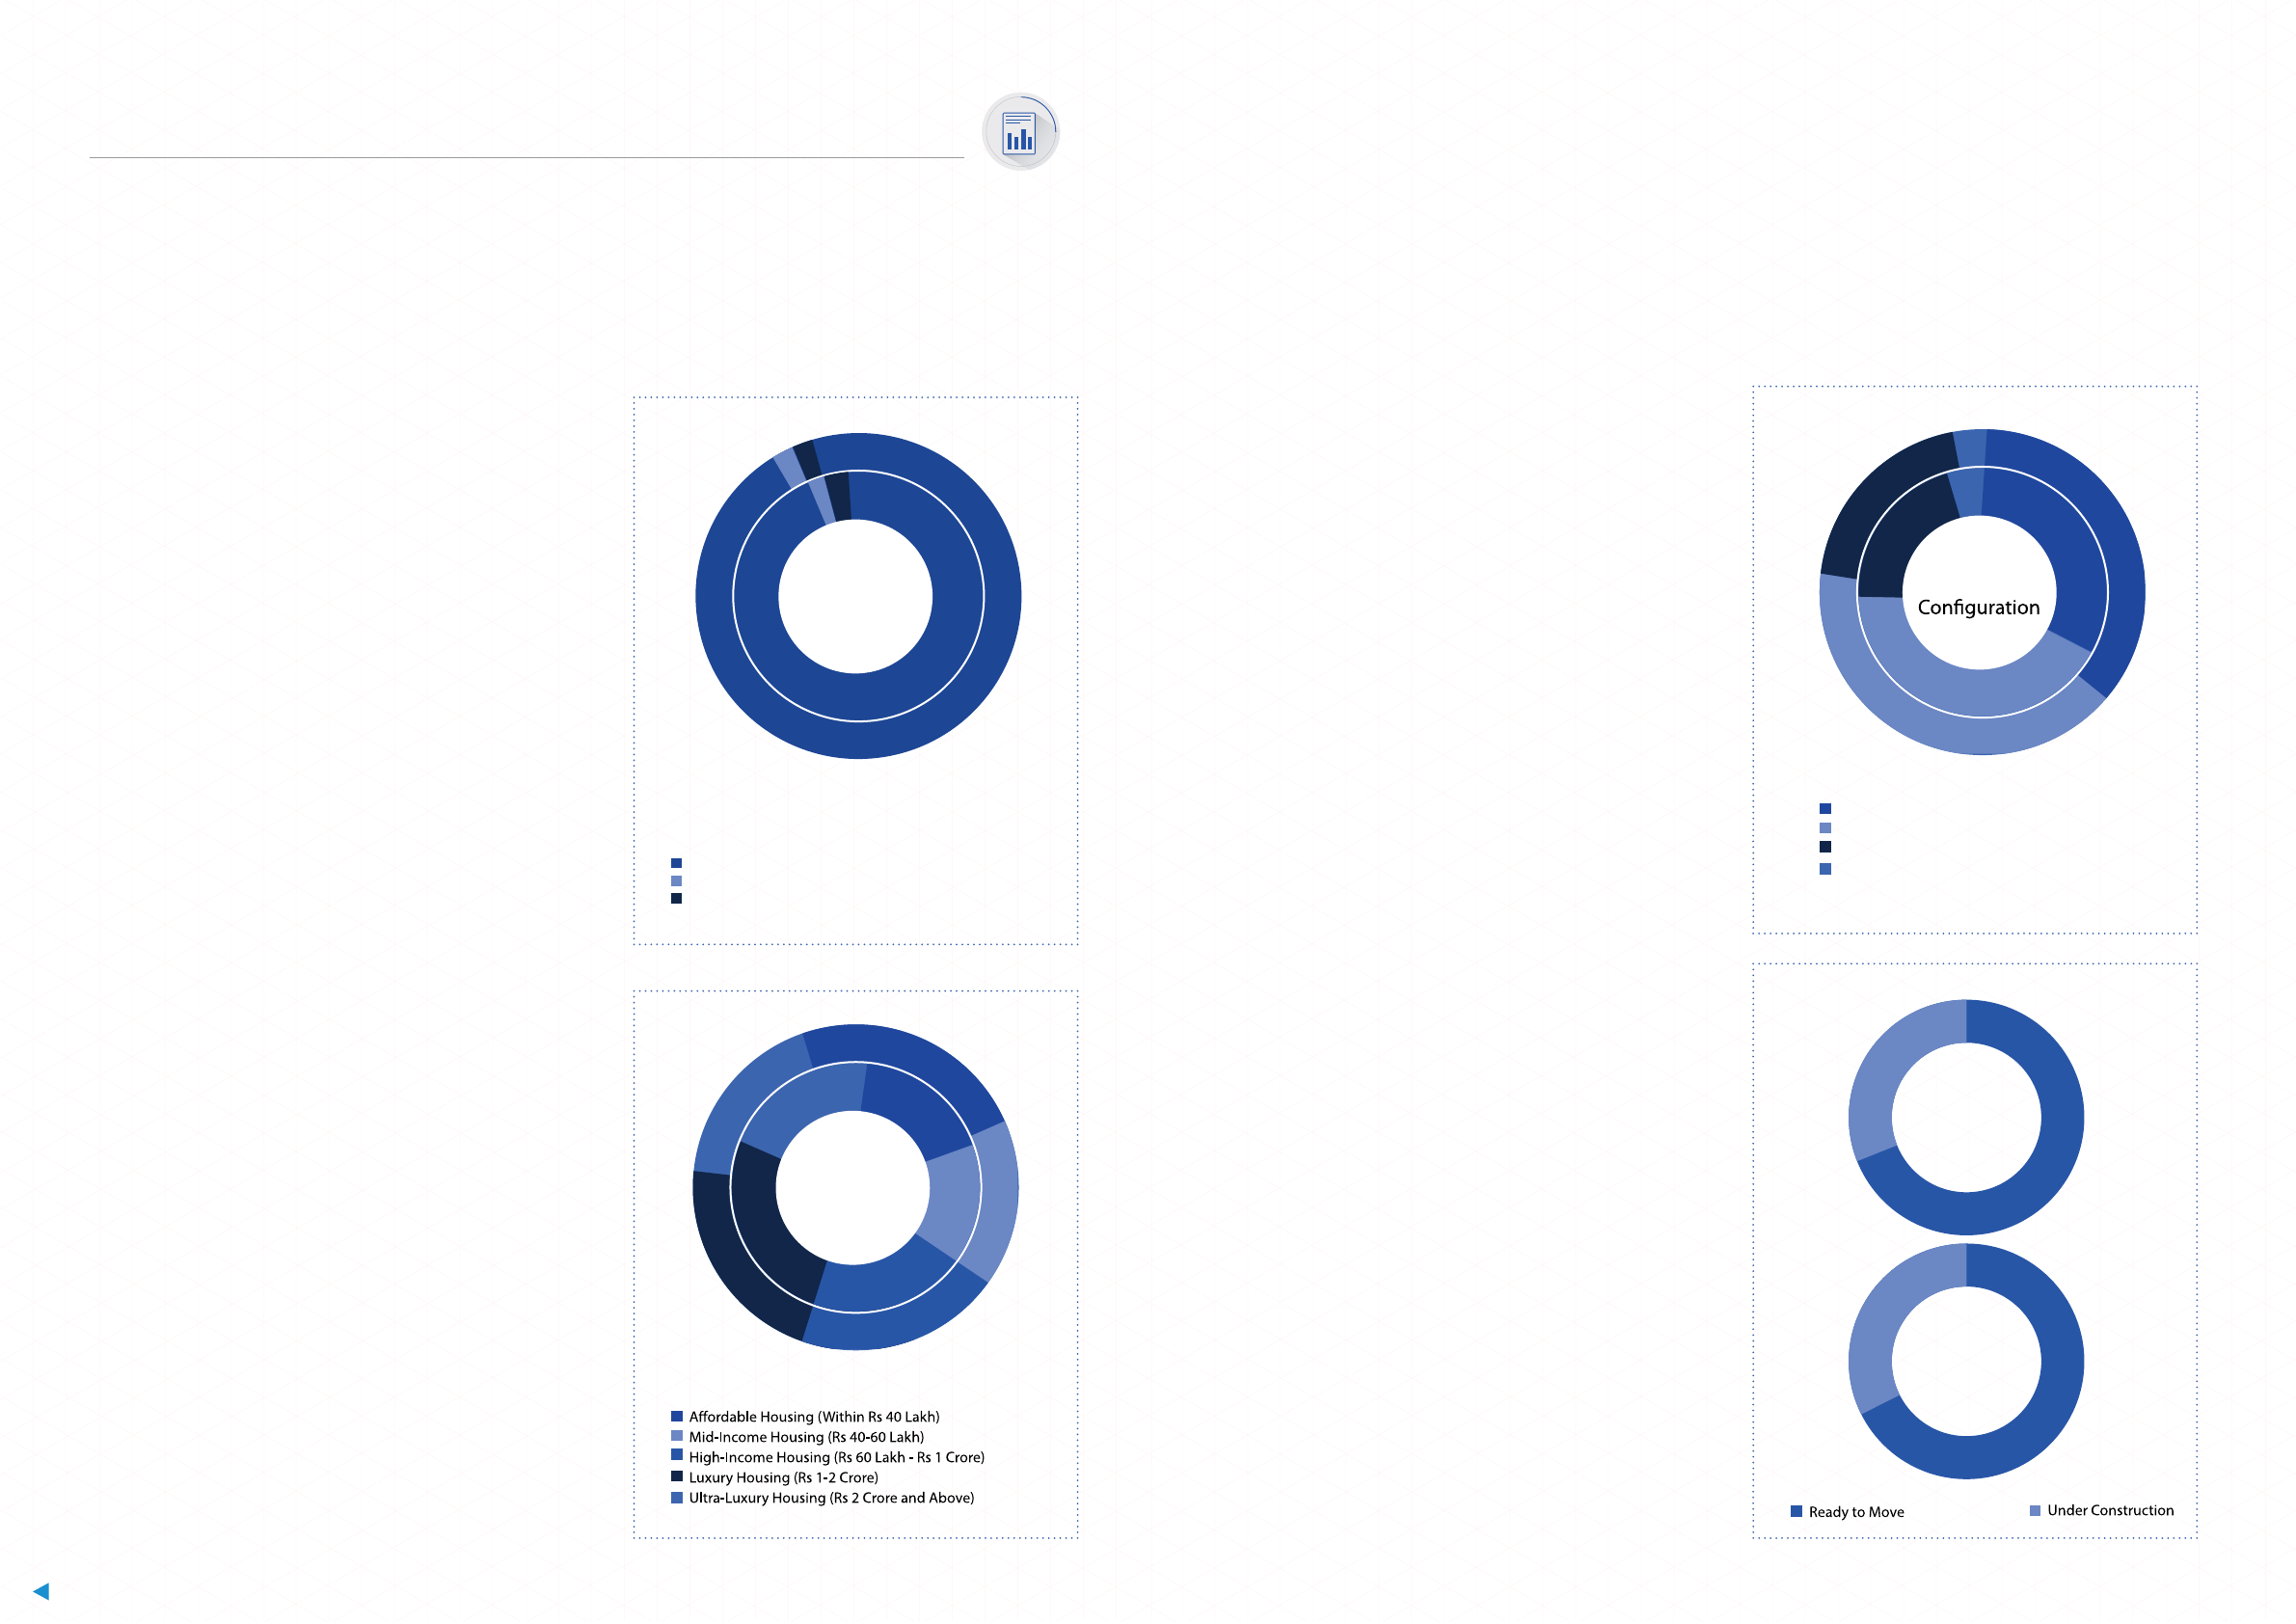
Availability of Different Property Types
Availability of Property by Budget
•
The prolonged lack of buyers has at last succeeded in
altering the market dynamics of Mumbai. In the Oct-Dec
2015 quarter, the supply of affordable properties, which
comprised properties within the price range of Rs 40 lakh,
ousted luxury (Rs 1-2 crore) and ultra-luxury (above Rs 2
crore) housing categories from their prime positions.
•
While almost a quarter of the market was captured by
affordable properties (houses priced below Rs 40 lakh),
the second largest supply was that of high-income
housing, which includes houses within the price range
of Rs 60 lakh - Rs 1 crore.
• Properties priced above Rs 1 crore captured a considerable
40 per cent of the market share, despite seeing a
downward trending graph of 10 per cent when compared
quarter-on-quarter.
•
Following the usual trend chart, the mid income bracket,
priced between Rs 60 lakh and Rs 1 crore, witnessed the
lowest supply, although the segment’s market share grew
insignificantly by a per cent from the Jul-Sep 2015 quarter
to Oct-Dec 2015.
Ready to move vs Under-construction
BHK-wise Distribution of Property
•
High capital rates and inequitable growth in income ensured
that properties congured as 1BHK and 2BHK remained the
most in demand.
•
In fact, Oct-Dec 2015 witnessed a substantial amount of
supply from the 3BHK and 4BHK unit categories spilling over
to the 1BHK bracket, thus leading to a ve per cent growth
in the market share of the latter. Even the 2BHK housing
category saw an insignicant dip in supply from Jul-Sep 2015.
•
Maximum properties congured as 1BHK and 2BHK, were
located in Navi Mumbai, which hosted over one-third of the
market in each category.
•
Andheri led the market in the supply of 3BHK and 4BHK
housing categories, capturing over a fth of the total market
share. South Mumbai, too, had a substantial share of 4BHK
houses.
•
In Thane, 2BHK apartments saw maximum takers, followed by
1BHK, which does not come as a surprise since the city hosts a
lot of properties priced below Rs 25 lakh. Over 60 per cent of
the properties in this region were congured as 1BHK.
•
Thane is the only zone in Mumbai which did not witness
demand for 4BHK units.
•
Quite surprisingly, properties congured as 4BHK units
did not curry favour with any region in Mumbai, although
the category saw decent footfall in South and South West
Mumbai. However, even in these two areas, 2BHK and 3BHK
were the most preferred.
•
Developers in Mumbai were increasingly focussing on
completing existing residential projects, xing their own
businesses and capital ow in a bid to win back homebuyers’
trust and clearing unsold stock that has been troubling them
for long. This trend is evident in the consistently dipping
1BHK
2BHK
3BHK
4BHK
• Not surprisingly, South Mumbai took the lead in
bagging the maximum supply of luxury and ultra-luxury
houses, capturing almost 50 per cent of the total market.
This zone was followed by Andheri-Dahisar which
bagged two-fifth of the properties with a price tag of
Rs 1 crore and above.
• Over 60 per cent of the properties in the affordable
category was situated in Navi Mumbai. Thane, too,
witnessed an almost equal share of reasonably-priced
properties. However, the two zones drew its uniqueness
from the fact that Navi Mumbai featured most properties
within the Rs 25-40 lakh bracket, while most houses in
Thane and areas beyond ranged below Rs 25 lakh.
• Houses priced within Rs 60 lakh and Rs 1 crore were highly
popular in Navi Mumbai, with the city capturing half the
total share of the market.
Residential Apartments
Independent Houses/Villas
Builder Floors
QoQ change in supply by
Property Type
Jul-Sep 2015
Oct-Dec 2015
2%
2%
1%
97%
97%
1%
Oct-Dec 2015
Jul-Sep 2015
24%
15%
13%
22%
27%
14%
22%
21%
23%
19%
QoQ change in supply by
Budget
Oct-Dec 2015
Jul-Sep 2015
38%
33%
42%
20%
5%
41%
18%
3%
QoQ change in supply by
(BHK)
Oct-Dec 2015
63%
37%
Jul-Sep 2015
62%
38%
number of under-construction properties in the last
three quarters, albeit minimally.
• In comparison to all the other areas, South and South
West Mumbai had the highest percentage of completed
homes. Over 70 per cent of the residential realty market
consisted of ready properties.
• While Thane also witnessed two-third of its properties
in the ready-to-move category, more than two-fth of
the market beyond Thane featured properties that are
under-construction.

99acres Insite
12
CAPITAL VALUES-NAVI MUMBAI
CAPITAL VALUES- MMR CAPITAL VALUES- MMR
Locality Oct-Dec 2015 % Change
Andheri (East) 18050 2
Andheri (West) 21950 -1
Bandra (West) 46750 4
Bandra Kurla
Complex 28700 2
Bevarly Park 8100 1
Bhandup (East) 12000 2
Bhayander (East) 7500 -3
Boisar 3500 8
Borivali (West) 16150 0
Breach Candy 61100 0
Byculla 26300 5
Chandivali 19100 -1
Charkop 13800 4
Chembur (East) 17437 6
Colaba 42200 0
Cue Parade 64700 -5
Dadar 36900 -3
Dahisar (East) 10700 -2
Deonar 21643 -5
Ghatkopar (West) 19700 -2
Gokul Township 4700 -3
Goregaon (East) 18000 -1
Jogeshwari (West) 16200 -3
Juhu 39300 2
Kandivali (East) 16300 2
Kanjur Marg
(West) 13500 8
Khar 41800 -2
Locality Oct-Dec 2015 % Change
Kurla (East) 14000 -1
Lokhandwala
Township 15750 1
Lower Parel 36000 1
Mahalaxmi 39850 -1
Mahim (West) 30000 -2
Malabar Hill 66750 -1
Malad (West) 15200 1
Matunga 33300 -5
Mira Bhayandar 8050 3
Mira Road 8350 1
Mulund 15250 -5
Naigaon (East) 4850 1
Palghar 3100 3
Pali Hill 52500 5
Parel 25350 -1
Peddar Road 57600 3
Powai 20750 -2
Prabhadevi 41150 -4
Sakinaka 16750 4
Santacruz (East) 21600 -4
Shivaji Park 41000 3
Vasai 5450 3
Vikhroli (East) 20500 7
Vile Parle (East) 29850 -2
Virar 4650 -2
Wadala 23550 -3
Worli 39200 4
RENTAL VALUES- MMR
RENTAL VALUES- MMR
Locality Oct-Dec 2015 % Change
Altamount Road 126 -9
Andheri (West) 49 4
Bandra (East) 56 -3
Bandra (West) 84 5
Bhandup (West) 34 10
Borivali (East) 31 7
Breach Candy 141 4
Chandivali 42 11
Chembur (East) 36 6
Cue Parade 124 -1
Dadar (East) 64 -2
Dahisar 20 5
Deonar 42 8
Ghatkopar (East) 36 -14
Ghatkopar (West) 39 5
Goregaon (West) 39 5
Hiranandani
Gardens - Powai 67 6
Juhu 71 3
Kanjur Marg
(West) 36 9
Khar (West) 81 5
Kurla (West) 37 6
Lokhandwala
Township 28 0
Lower Parel 81 16
Mahalaxmi 103 -3
Malabar Hill 135 3
Malad (East) 36 -3
Malad (West) 36 3
Marol 41 11
Mindspace 39 5
Locality Oct-Dec 2015 % Change
Mira Bhayandar 15 -6
Mira Road 16 7
Mulund (West) 33 6
Napean Sea Road 127 -2
Parel 73 -1
Peddar Road 126 1
Powai 46 10
Prabhadevi 88 5
Sakinaka 41 17
Santacruz (East) 48 4
Santacruz (West) 72 0
Sewri 81 4
Sion (East) 42 -2
Tardeo 156 1
Tilak Nagar 34 -3
Vakola 45 7
Vikhroli (East) 40 8
Vile Parle (East) 60 3
Vile Parle (West) 59 4
Wadala 51 4
Worli 98 -1
Worli Seaface 97 1
ANNEXURES
*All prices are per sq ft rates
*Capital values represent quarterly change
*Rental values represent yearly change
Locality Oct-Dec 2015 % Change
Airoli 10300 1
Belapur 10100 -3
Dronagiri 4600 2
Ghansoli 10700 0
CAPITAL VALUES-NAVI MUMBAI

99acres Insite
14 15
CAPITAL VALUES-NAVI MUMBAI
CAPITAL VALUES-THANE AND BEYOND
RENTAL VALUES-THANE AND BEYOND
RENTAL VALUES-NAVI MUMBAI
Locality Oct-Dec 2015 % Change
Airoli 22 5
Belapur 22 16
Ghansoli 20 5
Kamothe 11 0
Kharghar 14 0
Koperkhairane 22 0
Nerul 22 5
New Panvel 12 20
Palm Beach 29 16
Panvel 11 0
Roadpali 9 0
Sanpada 26 8
Seawoods 22 5
Ulwe 7 17
Vashi 26 8
Locality Oct-Dec 2015 % Change
Anand Nagar 19 12
Pokharan Road 22 10
Hiranandani Estate 25 9
Kasarvadavali 17 6
Waghbil 19 6
Manpada 22 5
Ghodbunder Road 18 0
Vasant Vihar 24 0
Dhokali 21 0
Hiranandani
Meadows 24 -8
Majiwada 21 -9
Locality Oct-Dec 2015 % Change
Kalamboli 6350 4
Kamothe 6900 1
Karanjade 5350 5
Khanda Colony 7583 2
Khandeshwar 6800 -1
Kharghar 8650 3
Koperkhairane 10000 -3
Kutak Bandhan 7300 -1
Nerul 12850 2
New Panvel 5500 -1
Palghar 3100 3
Palm Beach 18350 -1
Panvel 6150 -2
Roadpali 6750 -3
Sanpada 14150 0
Seawoods 11500 0
Sector 18, Kamothe 7000 1
Sector 19, Kamothe 6750 -2
Sector 20, Kamothe 7600 9
Sector 36, Kamothe 7400 8
Sector 8, Kharghar 10150 10
Sector 10, Kharghar 8850 6
Sector 14, Kharghar 10550 9
Sector 15, Kharghar 9000 2
Sector 19, Kharghar 9550 9
Sector 20, Kharghar 9200 3
Sector 36, Kharghar 7800 -5
Sector 11,
Koparkhairane 11050 1
Sector 2, Ulwe 6000 -2
*All prices are per sq ft rates
*Capital values represent quarterly change
*Rental values represent yearly change
*All prices are per sq ft rates
*Capital values represent quarterly change
*Rental values represent yearly change
Locality Oct-Dec 2015 % Change
Adharwadi 5700 4%
Ambernath 3350 -4%
Anand Nagar 9300 -2
Asangaon 2700 0
Badlapur 3350 0
Balkum 9400 -2
Bhiwandi 4000 5
Dhokali 10600 -2
Dombivli (East) 6300 2
Dombivli (West) 6500 4
G B Road 9550 -2
Hiranandani Estate 12900 1
Hiranandani
Meadows 21500 3
Kalher 3800 -1
Kalyan (East) 4100 3
Kalyan (West) 5650 -2
Kapurbawadi 12950 5
Karjat 2865 2
Kasarvadavali 9100 -2
Kharegaon 7500 1
Khopat 13750 1
Khopoli 3650 4
Kolshet 8700 -2
Kolshet Road 10300 5
Majiwada 11500 3
Manpada 11750 0
Mumbra 3700 3
Naupada 14800 -3
Neral 3000 2
Locality Oct-Dec 2015 % Change
Owale 8450 -2
Panch Pakhadi 13750 1
Parsik Nagar 9550 3
Patlipada 12206 6
Pokharan Road 12550 2
Pokhran-2 12150 0
Shivai Nagar 12800 -2
Teen Haath Naka 14942 0
Titwala 3200 2
Ulhasnagar 4000 -1
Vartak Nagar 11100 1
Vasant Vihar 12800 4
Waghbil 10000 4
CAPITAL VALUES-THANE AND BEYOND
CAPITAL VALUES-NAVI MUMBAI
Locality Oct-Dec 2015 % Change
Sector-8, Ulwe 6600 6
Sector 9, Ulwe 6400 7
Sector 17, Ulwe 6400 8
Sector 19, Ulwe 5850 4
Shilphata 5650 -2
Taloja 5150 4
Taloja Panchanand 4950 0
Vashi 12800 1
Vichumbe 4750 8
Contact Us
0120 308 2248
Monday - Friday
9:30 AM to 6:30 PM IST
Email: [email protected]
Credentials of www.99acres.com
5 Million Unique Visitors a month
9 Million Visitors a month
11 Lakh Residential and Commercial Properties
10 Lakh Searches everyday
1.5 New Projects
20% NRI Visitors
2.5 Million Registered Database
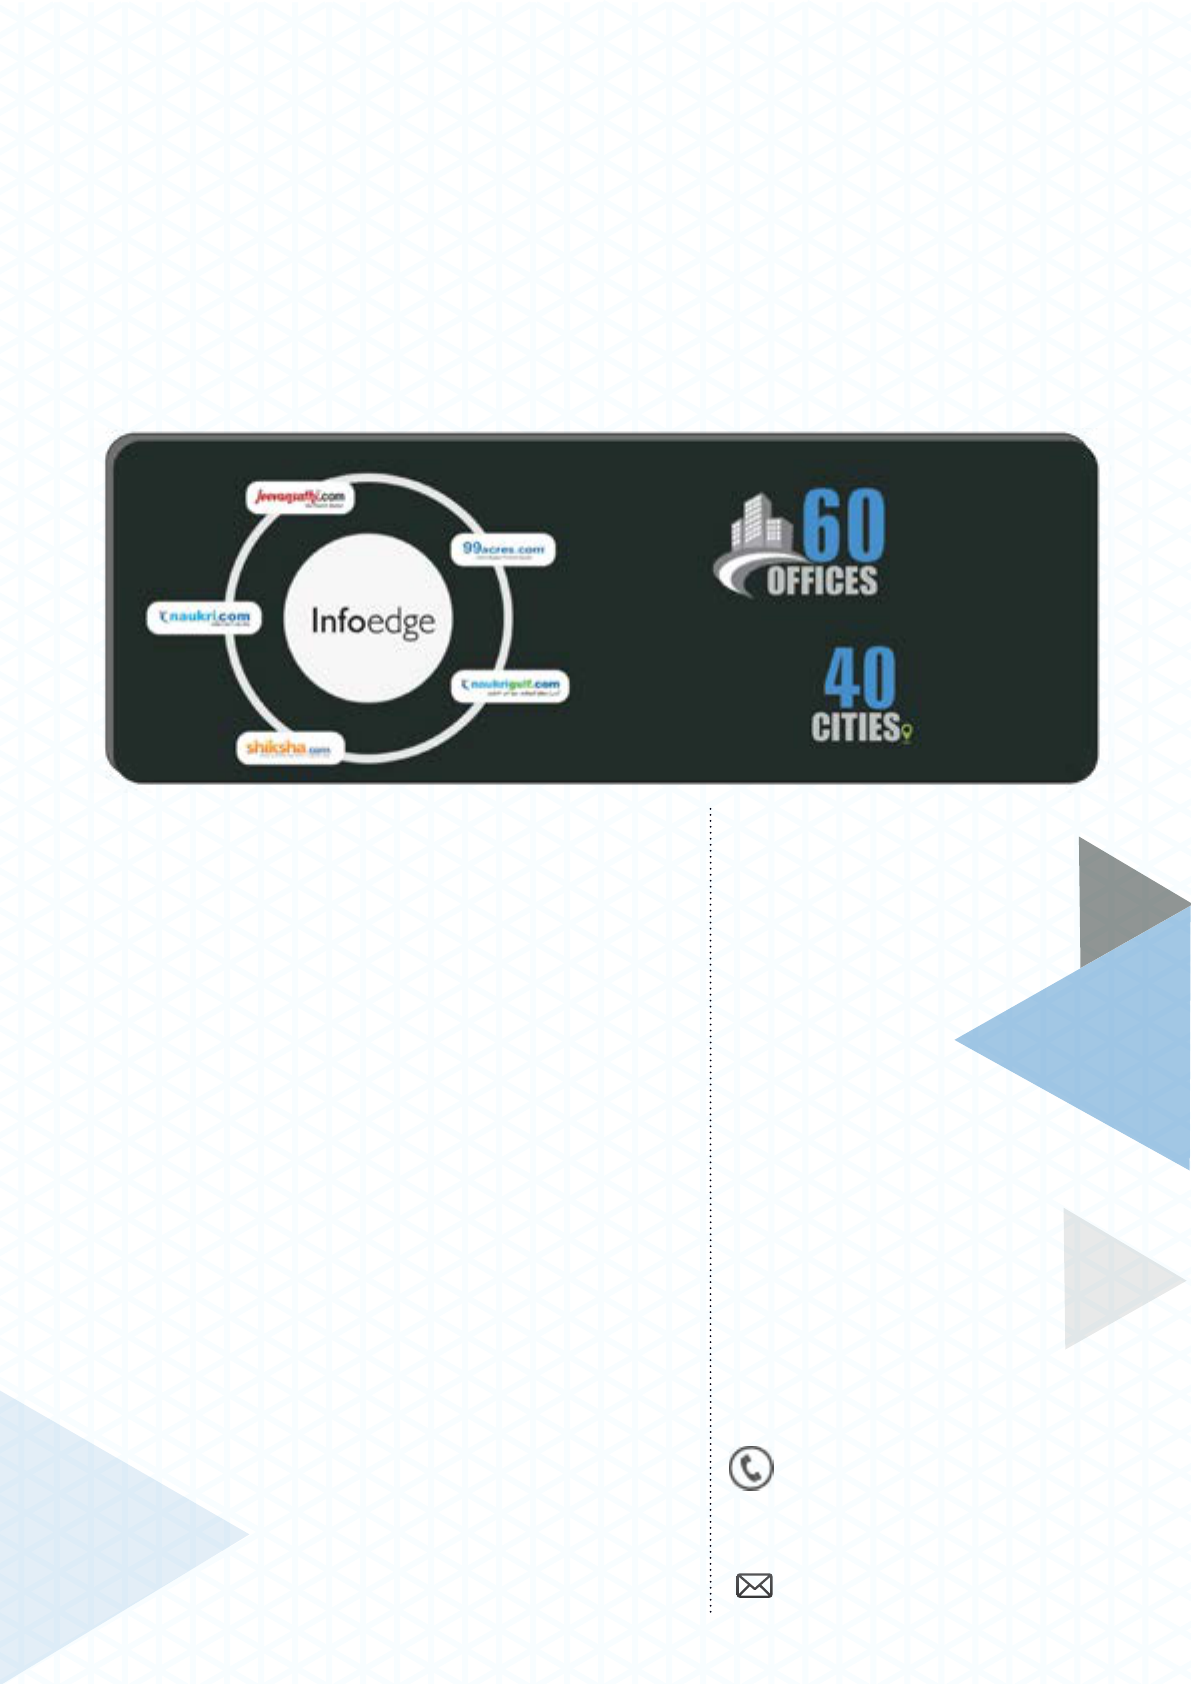
Our Heritage
First Internet Company to be Listed
Info Edge (India) Ltd is India’s premier on-line classieds company in recruitment,
real estate, matrimony and education.
A USD 1.5 Billion listed Indian Internet Conglomerate
