
Real Insight
Residential
April-June 2023
RESEARCH

01
Real Insight Residential – April-June 2023
TABLE OF CONTENTS
1. Overview
2. Property Market Trends
• New Supply
• Sales
• Price
• Unsold Inventory
• Top Trending Realty Hotspots
RESEARCH

Overview
The global economy is making steady progress in recovering from the challenges posed by the
pandemic and Russia's invasion of Ukraine. China's reopened economy is rebounding, while
supply chain disruptions are gradually unwinding. Simultaneously, most central banks'
synchronized tightening of monetary policy is expected to bear fruit as inflation moves back
towards targets.
Amidst this global context, the outlook for Asia and the Pacific remains dynamic, largely driven
by the optimistic prospects of China and India. Both the countries are expected to be the main
drivers of global growth this year, despite the challenges facing the rest of the world.
According to the International Monetary Fund (IMF), the two countries are expected to
contribute about half of global growth, with the rest of Asia and the Pacific contributing an
additional one-fifth.
This positive trend is reflected in India's leading indicators as well. Both the manufacturing and
services Purchasing Managers' Index (PMI) have surpassed the above-50 mark, reaching 57.8
and 58.5, respectively, in June 2023. The unemployment rate has decreased to 7.7per cent in
May 2023 from the previous month's 8.5per cent. Consumption indicators such as fuel, power,
automobile sales, and Goods and Services Tax (GST) collections have maintained upward
momentum throughout the first half of 2023. Additionally, inflation levels in the country have
remained within Central Bank's target range
This growth in consumption across sectors is mirrored in the property markets, which have
sustained their growth momentum in the first half of the year. The primary residential market
in the top-eight cities has witnessed double-digit growth, with new supply and sales recording
a half-yearly year-on-year increase of 44per cent and 15per cent, respectively.
Mumbai and Pune saw the highest growth among the top-eight cities, with 26per cent each in
H1 2023. On a quarterly basis, there is an 11per cent year-on-year increase in supply, while
sales in the primary market registered an 8per cent increase compared to same period of the
preceding year.
The real estate market is currently witnessing an impressive surge, as sales velocity maintains
its momentum, and new supply exceeds demand. Property prices are experiencing a notable
uptick, with all major metros showing a weighted average year-on-year increase of 6-7 per
cent. Notably, key localities in cities such as Gurugram, Hyderabad, and Bengaluru are also
seeing sharp spikes in prices due to a significant demand-supply mismatch, especially for
ready-to-move-in properties.
Even with successive rate hikes followed by a pause from the Central Bank, the market
sentiment remains buoyed by a renewed interest in home ownership. The evidence of this
sustained demand is clearly reflected in our IRIS index, a prominent indicator of upcoming
property demand in key Indian cities, which has consistently maintained a score of 100 during
Q2 2023.
Taking these prevailing trends into account, we hold a strong belief that both sales and supply
will sustain their momentum in the upcoming quarters.
Real Insight Residential – April-June 2023
02
RESEARCH

03
Real Insight Residential – April-June 2023
ALL-INDIA RESIDENTIAL
REAL ESTATE TRENDS
RESEARCH
04
Real Insight Residential – April-June 2023
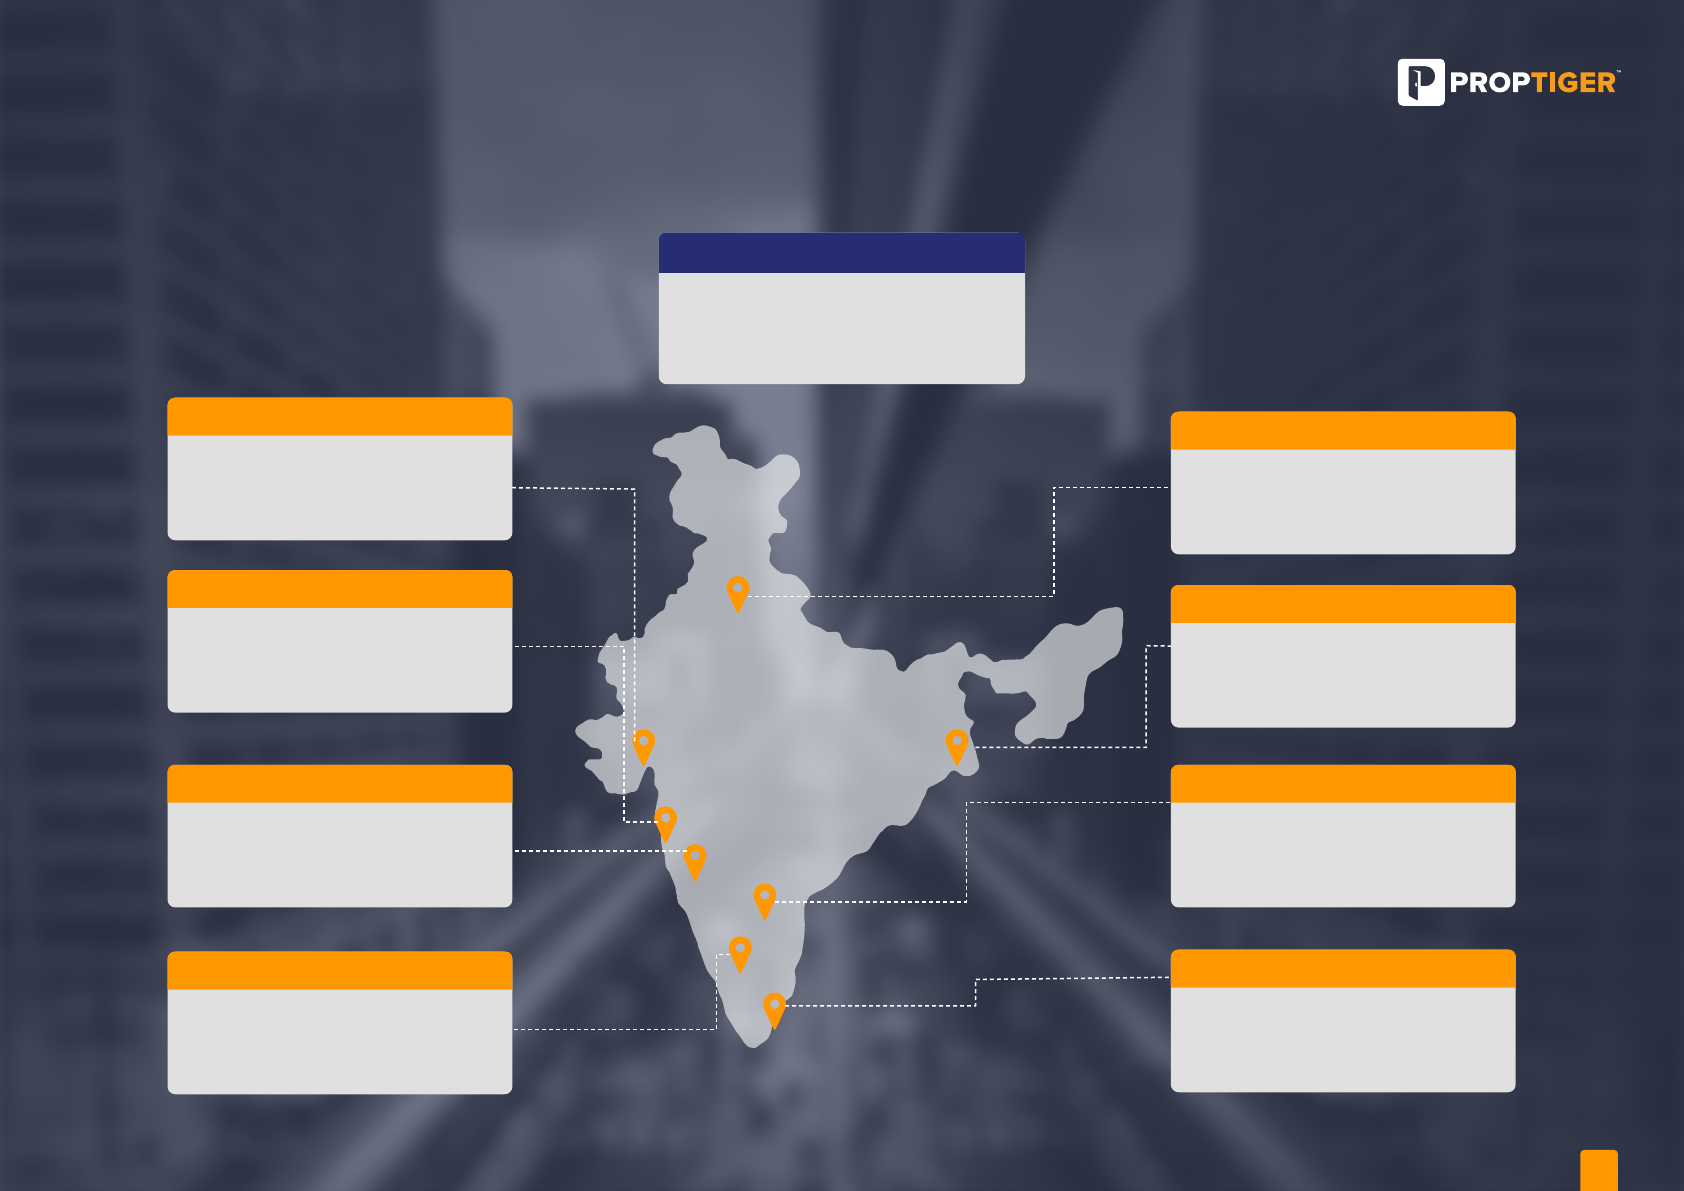
RESIDENTIAL LANDSCAPE Q2 2023
(YoY growth in new supply and demand in Q2 2023)
Source: PropTiger Research
TOP 8 CITIES
New supply
Sales
Inventory overhang
11%
8%
34 months
AHMEDABAD
New supply
Sales
Inventory overhang
126%
17%
33 months
MUMBAI
New supply
Sales
Inventory overhang
-23%
16%
33 months
PUNE
New supply
Sales
Inventory overhang
99%
37%
97 months
BENGALURU
New supply
Sales
Inventory overhang
-37%
-19%
36 months
DELHI NCR
New supply
Sales
Inventory overhang
43%
-28%
72 months
HYDERABAD
New supply
Sales
Inventory overhang
-27%
-3%
39 months
CHENNAI
New supply
Sales
Inventory overhang
-5%
10%
28 months
KOLKATA
New supply
Sales
Inventory overhang
74%
-40%
34 months
RESEARCH

Source: PropTiger Research
1. New supply
• The new residential supply reached 1.12 lakh units by the end of the April-June 2023
quarter, marking an encouraging year-on-year growth of 11 per cent in Q2 2023 compared
to the same period of the previous year. While there was a sequential drop of 23 per cent,
it's noteworthy that the supply has consistently remained above the 1-lakh mark for five
consecutive quarters. Fuelled by strengthened sentiments for homeownership demand
has kept up pace, instilling confidence in the developers to launch new projects post the
realty downcycle and the pandemic induced lull.
• Mumbai, Pune, and Ahmedabad led the supply tally in the June quarter, accounting for a
significant 72 per cent share from the overall new launches in the top eight cities during Q2
2023. Micro market trends suggest that Thane West and Dombivli in Mumbai and Charholi
Budruk in Pune witnessed maximum new launched in June quarter.
• New supply in the more than INR 45-75 lakh price bracket took the highest share of 33 per
cent, followed by more than INR 1 crore price bracket which accounted a share of 29 per
cent in overall new supply.
• Developers across cities have placed a strong emphasis on the 2 BHK configuration, which
accounted for a 39 per cent share in the total new supply tally, closely followed by the 3
BHK configuration, with a share of 31 per cent. Our consumer sentiment survey indicates a
growing interest in amongst homebuyers for upgrading to larger configurations, likely due
to the work-from-home and hybrid work scenarios across the metros.
• We see developers are placing a strong focus on larger configurations and amenities that
align with evolving consumer preferences post-pandemic. These include healthcare
facilities, safety and security measures, as well as abundant open and recreational spaces.
This shift exemplifies a trend in meeting the changing demands of homebuyers.
Q2 2022
1,02,130
Q1 2023
1,47,790
Q2 2023
1,13,770
11% YoY
-23% QoQ
Ahmedabad, 9%
Bangalore, 12%
Chennai, 2%
Delhi NCR, 3%
Hyderabad, 16%
Kolkata, 2%
Mumbai, 42%
Pune, 13%
Ahmedabad, 19%
Bangalore, 7%
Chennai, 4%
Delhi NCR, 4%
Hyderabad, 11%
Kolkata, 3%
Mumbai, 29%
Pune, 23%
New supply - City-wise share
Source: PropTiger Research
0
50,000
100,000
150,000
Q1 20
Q2 20
Q3 20
Q4 20
Q1 21
Q2 21
Q3 21
Q4 21
Q1 22
Q2 22
Q3 22
Q4 22
Q1 23
Q2 23
Number of units
New supply trend
10%
6%
23%
18%
28%
33%
10%
14%
29%
29%
Q2 2022
Q2 2023
New Supply - Ticket-wise split
< INR 25 lakh INR 25-45 lakh INR 45-75 lakh INR 75-100 lakh > INR 1 crore
Q2 2022
Q2 2023
Note: Units rounded off to nearest thousands.
05
Real Insight Residential – April-June 2023
RESEARCH

2. Sales
• In Q2 2023, property demand across the top-eight cities has sustained its momentum,
witnessing a year-on-year growth of 8 per cent with a total of 80,255 units sold during this
period. However, similar to the new supply, sales experienced a sequential dip of 7 per cent
in the June quarter.
• According to our consumer and market insights, homebuyers are facing challenges in
finding properties that align with their budget and location preferences. For instance, while
58 per cent of the prospective homebuyers are seeking ready-to-move-in (RTMI)
properties, only 19 per cent of the total available options meet this criterion.
• Similar to supply, Mumbai and Pune took the highest combined share of 60 per cent in
overall sales in Q2 2023. Deeper insights indicate that Thane West and Dombivli in
Mumbai and Hadapsar in Pune witnessed maximum traction in the bygone quarter.
• Majority of residential sales in Q2 2023, comprising 27 per cent, were concentrated in the
INR 45-75 lakh price bracket, closely followed by the more than 1 crore price bracket, which
accounted for a 25 per cent share. Notably, this segment has consistently maintained its
share in the overall sales tally post the pandemic and has experienced a growth of 9
percent as compared to the same period in 2019. Mumbai and Pune continued to be the
top contributors to overall sales, jointly accounting for 60per cent of the market share.
• The market is experiencing a complex interplay of factors, with supply surpassing demand,
yet sales velocity struggling to keep up. The impact of consecutive rate hikes varies across
different price brackets, with the lower end facing more challenges. Additionally, the
demand for ready-to-move-in properties is not being met adequately by the current new
supply. All these factors, combined with increased input costs and demand-supply
mismatch, have led to a situation where some homebuyers are currently in a wait and watch
mode about entering the market.
Source: PropTiger Research
Q2 2022
74,320
Q1 2023
85,840
Q2 2023
80,250
8% YoY
-7% QoQ
Note: Units rounded off to nearest thousands.
Ahmedabad, 8%
Bangalore, 11%
Chennai, 5%
Delhi NCR, 7%
Hyderabad, 9%
Kolkata, 4%
Mumbai, 33%
Pune, 23%
Ahmedabad, 8%
Bangalore, 9%
Chennai, 4%
Delhi NCR, 4%
Hyderabad, 12%
Kolkata, 3%
Mumbai, 38%
Pune, 22%
- City-wise split
Source: PropTiger Research
16%
13%
24%
22%
26%
27%
11%
13%
23%
25%
Q2 2022
Q2 2023
Property sales
Property sales
- Ticket-wise split
< INR 25 lakh INR 25-45 lakh INR 45-75 lakh INR 75-100 lakh > INR 1 crore
0
20,000
40,000
60,000
80,000
100,000
Q1 20
Q2 20
Q3 20
Q4 20
Q1 21
Q2 21
Q3 21
Q4 21
Q1 22
Q2 22
Q3 22
Q4 22
Q1 23
Q2 23
Number of units
Property sales
Q2 2022
Q3 2023
06
Real Insight Residential – April-June 2023
RESEARCH
* Weighted average price as per new supply and inventory adjusted to CPI inflation. Base year for index is 2019.
Source: PropTiger Research
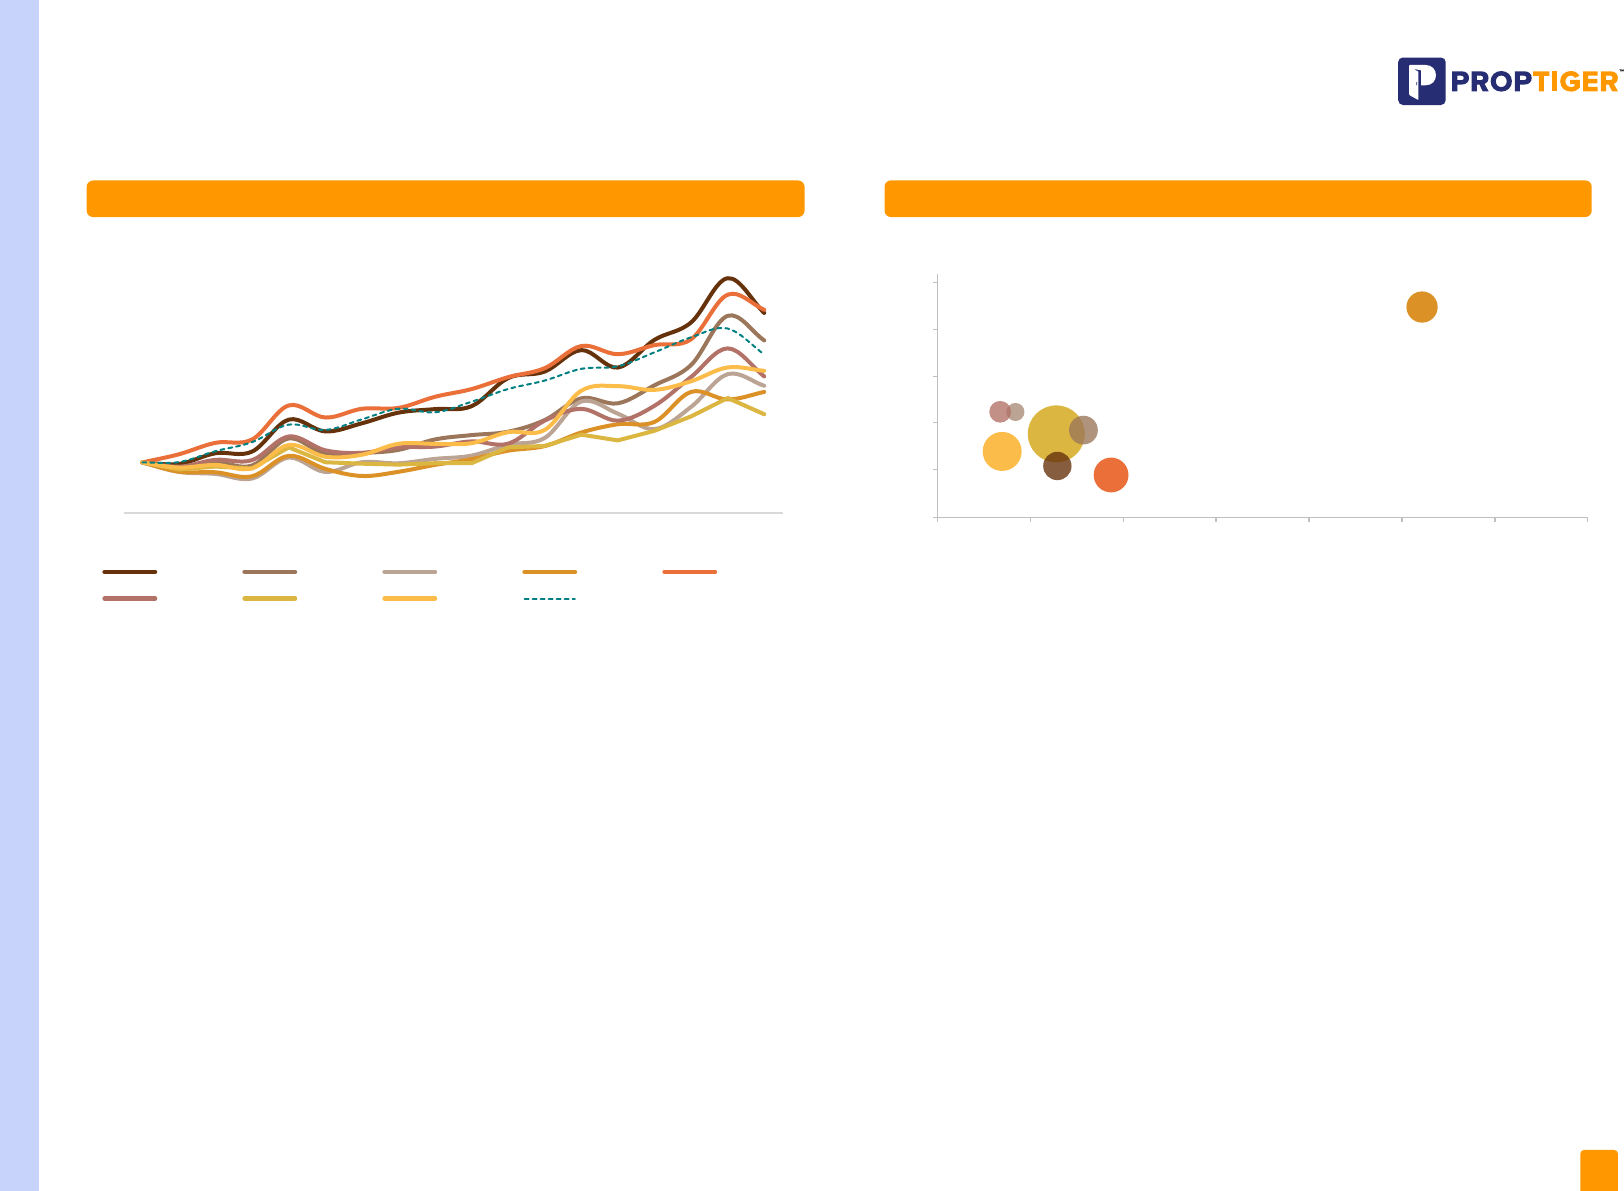
3. Price 4. Unsold Inventory
• Property prices for new supply and available inventory in the top eight cities recorded a 6 per
cent YoY uptick in Q2 2023. Partial passing-on the increased input cost on to the
homebuyers, premium attached to the much in demand but limited in supply
ready-to-move-in property and increasing interest rates have all contributed to the post
pandemic spike in property prices across cities.
• Major metros registered a weighted average year-on-year increase of 6-7 per cent, with key
localities in Gurugram, Hyderabad, and Bengaluru witnessing sharp double-digit spikes in
prices due to a demand-supply mismatch, particularly for ready-to-move-in properties.
• Gurugram and Bengaluru emerged as the frontrunners in property price growth in Q2 2023,
boasting a year-on-year 12 per cent and 9 per cent respective increase in capital values.
• The unsold inventory in the top eight cities at the end of March 2023 stood at 9.44 lakh
units, registering concerning a year-on-year increase of 24 per cent in Q2 2023. With the
new supply outpacing sales velocity, unsold inventory levels have been pushed to a
three-year high.
• Despite steady sales, Mumbai, Pune together accounted for a share of 52 per cent in the
overall 9.44 lakh unsold units in the second quarter of 2023.
• Hyderabad recorded the highest uptick of 52 per cent YoY in unsold inventory in Q2 2023
compared to top-eight cities. The city has witnessed significant influx of fresh units post
the pandemic. However, the sales momentum hasn't kept pace with this surge, leading to
an increase in unsold inventory.
• The inventory overhang across the top-eight cities remained unchanged at 34 months at
the end of Q2 2023, same as the corresponding period in the previous year. At the current
sales velocity, it will take at least 2.8 years to liquidate the current primary market unsold
stock staggered across different stages of construction in the top- eight cities.
* Unsold inventory as of June 2023
Source: PropTiger Research
90
100
110
120
130
140
Q1 19
Q2 19
Q3 19
Q4 19
Q1 20
Q2 20
Q3 20
Q4 20
Q1 21
Q2 21
Q3 21
Q4 21
Q1 22
Q2 22
Q3 22
Q4 22
Q1 23
Q2 23
Ahmedabad Bengaluru Chennai Delhi NCR Hyderabad
Kolkata Mumbai Pune CPI
Ahmedabad
Bengaluru
Chennai
Kolkata
Delhi NCR
Hyderabad
Kolkata
Mumbai
Pune
0
20
40
60
80
100
20
30
40 50 60 70 80 90
Age of unsold inventory (Months)
Inventory Overhang (Months)
Weighted average price*
City-wise - Unsold inventory and inventory overhang
07
Real Insight Residential – April-June 2023
RESEARCH
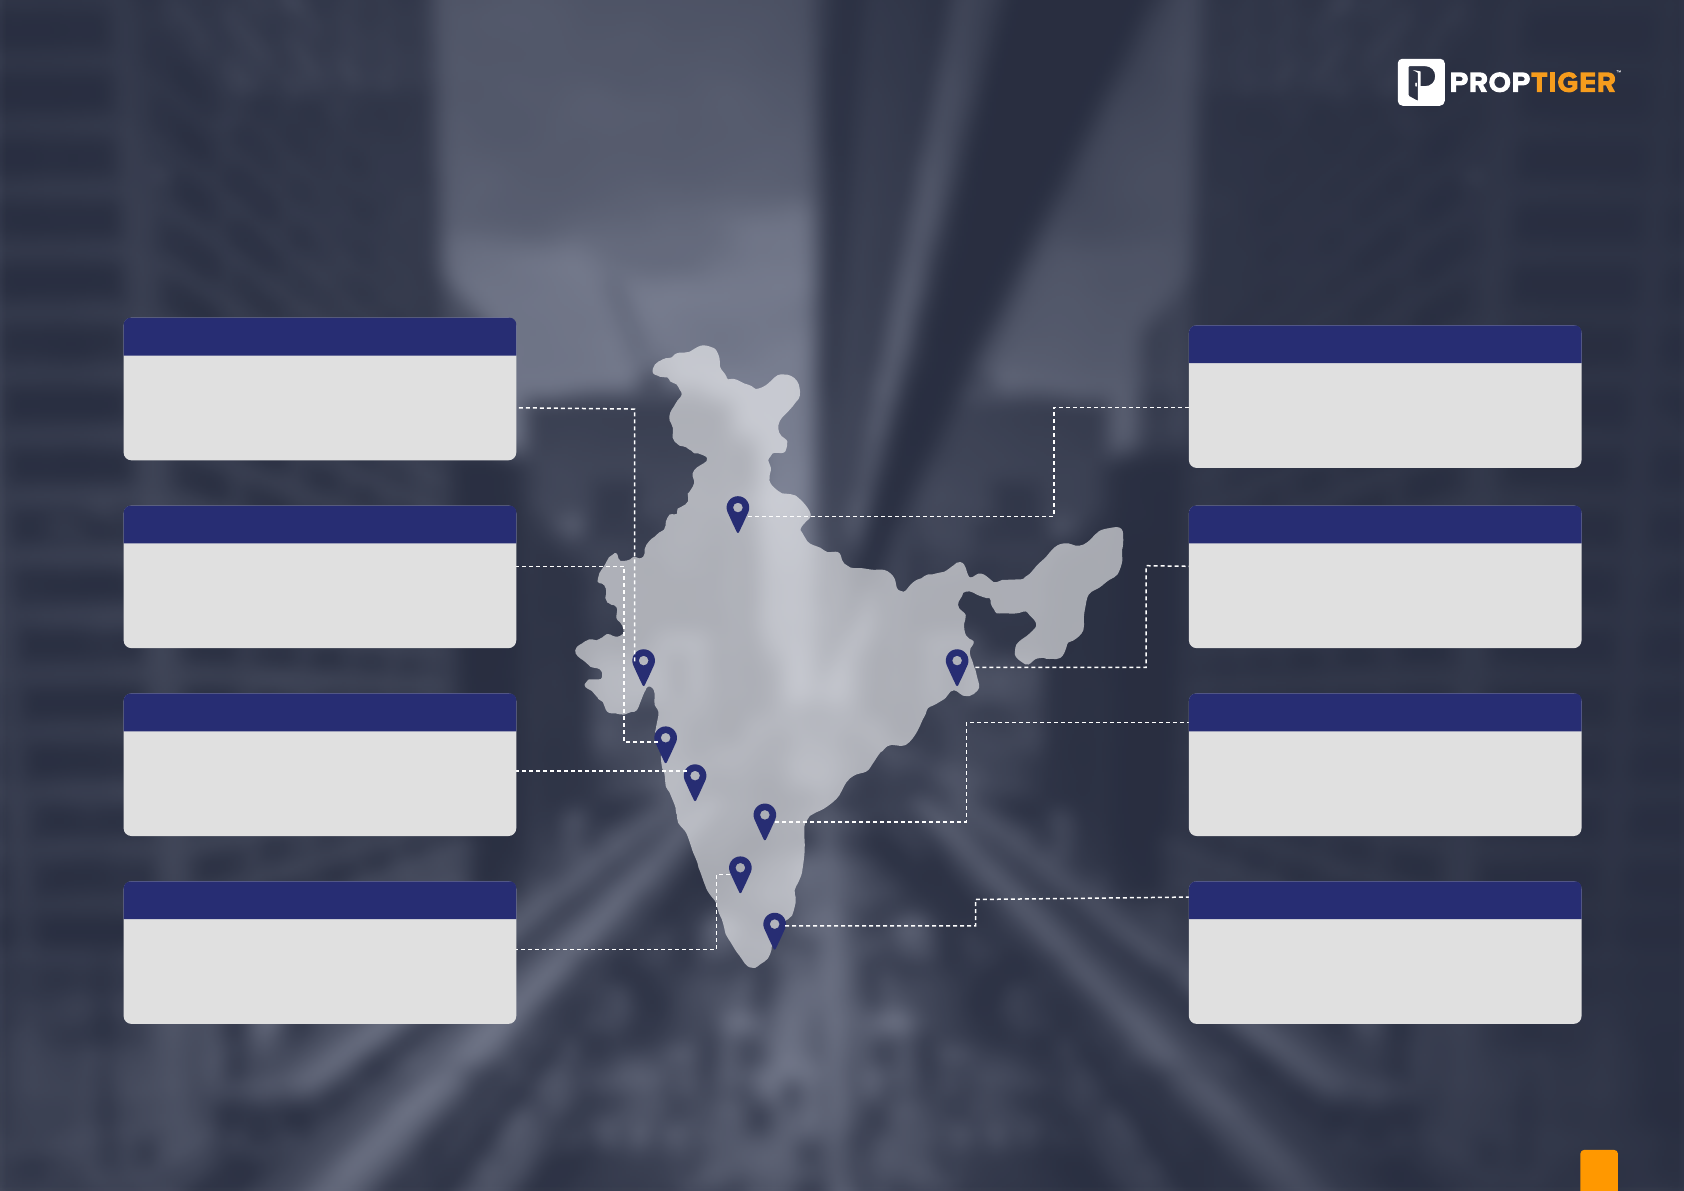
TOP TRENDING REALTY HOTSPOTS
(City-wise top-3 localities ranked as per residentials sales)
Source: PropTiger Research
AHMEDABAD
Nava Naroda
Shela
Gota
INR 3,300-3,500 /sq.ft
INR 4,600-4,800 /sq.ft
INR 4,500-4,700 /sq.ft
MUMBAI
Thane West
Dombivli
Panvel
IINR 10,900-11,100 /sq.ft
INR 6,500-6,700 /sq.ft
INR 6,200-6,400 /sq.ft
PUNE
Hadapsar
Charholi Budruk
Tathawade
INR 6,300-6,500 /sq.ft
INR 5,600-5,800 /sq.ft
INR 5,000-5,200 /sq.ft
BENGALURU
Whitefield
Varthur
Sarjapur
INR 6,200-6,400 /sq.ft
INR 5,400-5,600 /sq.ft
INR 6,500-6,700 /sq.ft
KOLKATA
New Town
Joka
Rajarhat
INR 4,600-4,800 /sq.ft
INR 3,600-3,800 /sq.ft
INR 4,000-4,200 /sq.ft
HYDERABAD
Kollur
Kokapet
Bachupally
INR 4,800-5,000 /sq.ft
INR 7,700-7,900 /sq.ft
INR 5,400-5,600 /sq.ft
CHENNAI
Manapakkam
Sholinganallur
Pallikaranai
INR 5,900-6,100 /sq.ft
INR 5,300-5,500 /sq.ft
INR 5,700-5,900 /sq.ft
DELHI NCR
Sector 1 Noida Extension
(Greater Noida)
Sector 150 (Noida)
Raj Nagar Extension
(Ghaziabad)
INR 3,700-3,900 /sq.ft
INR 5,600-5,800 /sq.ft
INR 3,400-3,600 /sq.ft
* Weighted average price as per new supply and inventory adjusted to CPI inflation.
08
Real Insight Residential – April-June 2023
RESEARCH
Real Insight Residential – April-June 2023
09
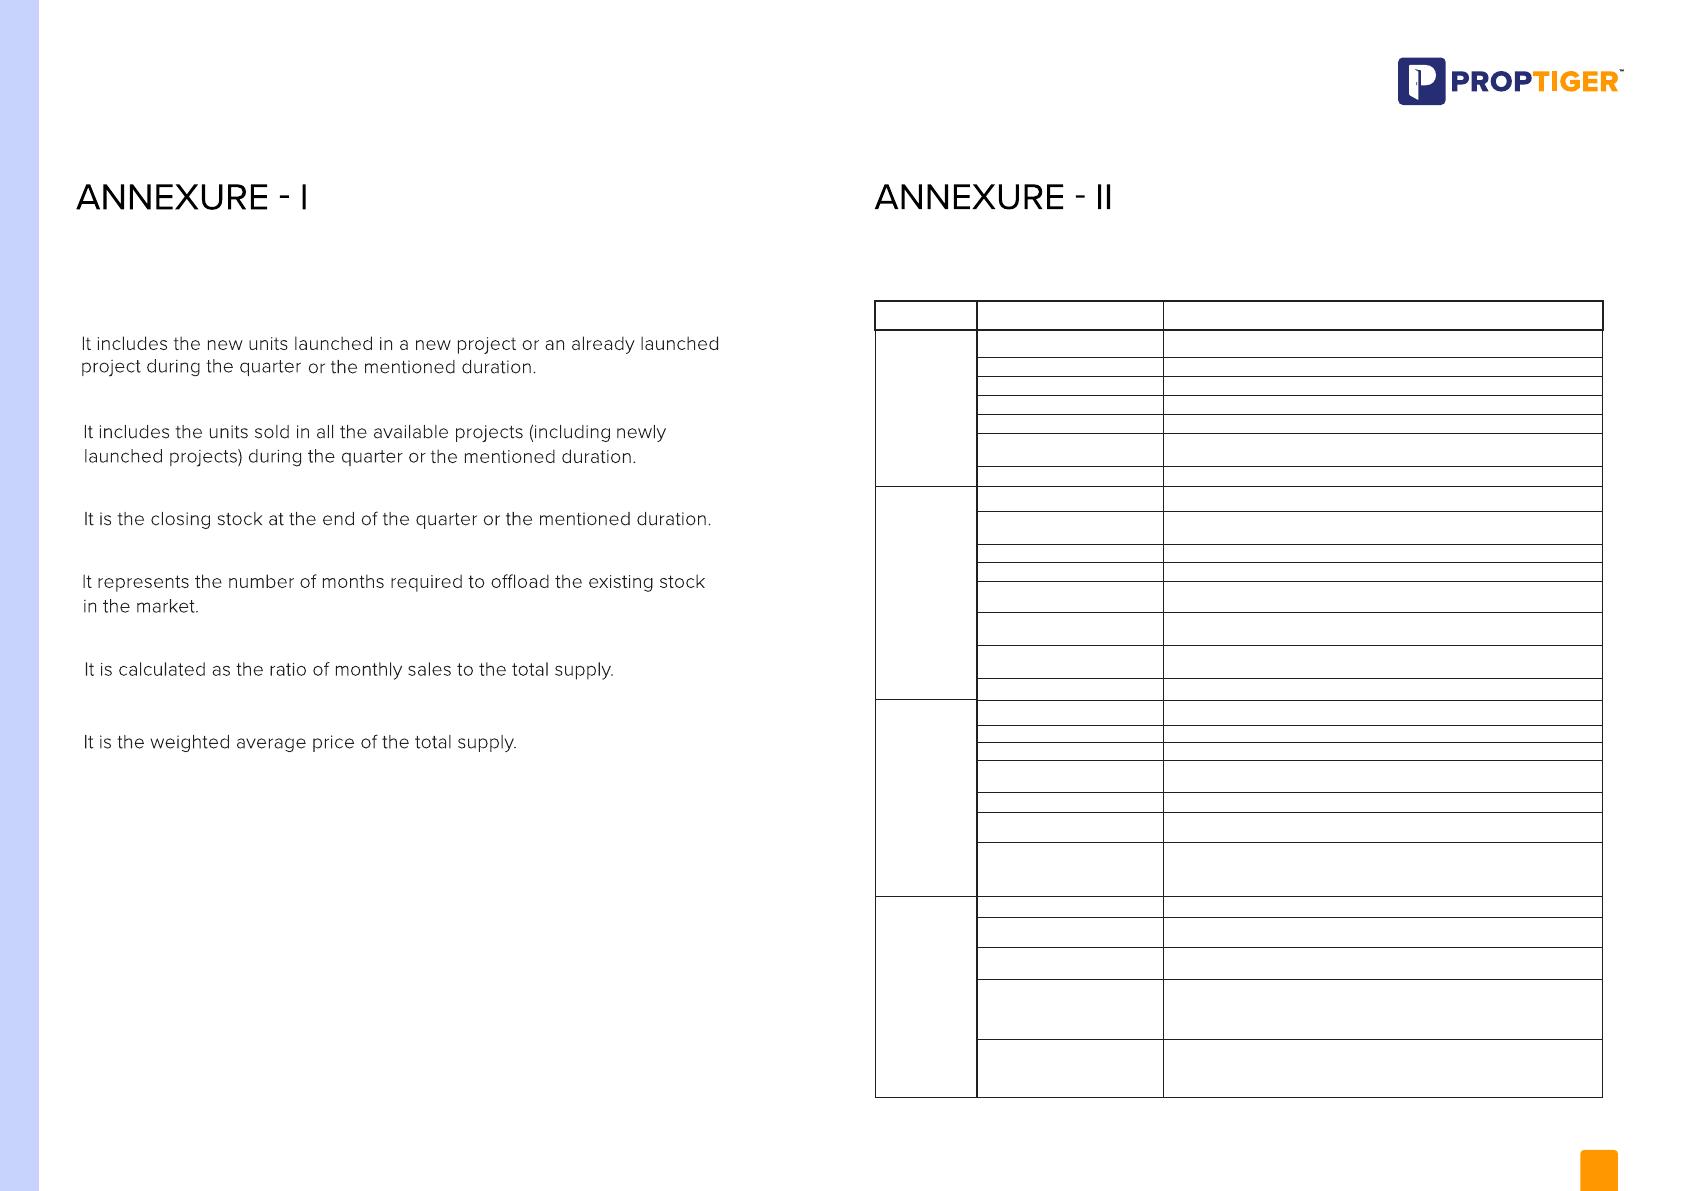
New supply:
Sales:
Unsold inventory:
Inventory overhang:
Sales velocity:
Price:
Note:
Analysis in the report includes apartments and villas only. RERA registration
date is considered as day zero for
recording new supply and sales.
Glossary
City Micro market Prominent localities
Ahmedabad Ahmedabad Central Ellisbridge, Paldi, Saraspur, Vasna
Ahmedabad East Bapu Nagar, Nava Naroda, New Maninagar, Nikol, Odhav, Vastral
Ahmedabad North Chandkhera, Gota, Motera, Nana Chiloda, Ranip, Vadsar
Ahmedabad South Vatva, Narol, Narolgam, Isanpur, Changodar
Ahmedabad West Bopal, Ghuma, Shela, Sarkhej, Shilaj, Sanand, Vastrapura
SG Highway Near Nirma University On SG Highway, Near Vaishno Devi circle on SG Highway,
Thaltej, Chanakyapuri
Gandhinagar Urjanagar, Sargaasan, Gift City, Zundal, Rayson
Bengaluru Central Bengaluru Ashok Nagar, Richmond Town, Marathahalli, Bellandur, Frazer Town, Koramangala,
East Bengaluru Whitefield Hope Farm Junction, CV Raman Nagar, KR Puram, Mahadevapura,
Harlur, Sarjapur, ITPL, Varthur, Budigere Cross
North Bengaluru Yelahanka, Doddaballapur, Hebbal, Thanisandra, Jakkur, Kodigehalli, Kannur
North East Bengaluru Horamavu, Devanahalli, Narayanapura, Hennur, Banaswadi, Kalyan Nagar
North West Bengaluru Jalahalli, Yeshwantpur, Nelamangala Town, Rajaji Nagar, Near Peenya Industrial
Area
South Bengaluru Begur, JP Nagar, Bommanahalli, Gottigere, Hosa Road, Padmanabha Nagar,
Hulimavu
South East Bengaluru Electronics City, Hosur, Anekal City, Jigani, Chandapura, Attibele, Bommasandra,
Narayanaghatta, Avalahalli
West Bengaluru Kumbalgodu, Kengeri, Nagarbhavi
Chennai Chennai Central Anna Nagar, Alwarpet, Guindy, Raja Annamalai Puram, Vadapalani
Chennai North Perembur, Madhavaram, Kolathur, Ponneri
Chennai South Perrumbakkam, Mambakkam, Thiruporur
Chennai West Avadi, Koyembedu, Manapakkam, Mangadu, Mogappair, Vanagram, Thirumazhisai,
Mevalurkuppam, Ambattur
ECR Injambakkam, Thiruvanmiyur, Kanathur Reddikuppam
GST Guduvencheri, Perungalathur, Singaperumal Koil, Orgadam, Maraimalai Nagar,
Tambaram, Chromepet
OMR Padur, Perungudi, Sholinganallur, Siruseri, Thalambur, Medavakkam, Kelambakkam,
Tiruporur Near Kelambakkam Vandalur Kelambakkam Road Moolacheri,
Nallambakkam
Delhi-NCR Faridabad Ballabhgarh, Greater Faridabad, Hodal, NH2, Surajkund
Ghaziabad Ghaziabad Central, Indirapuram, Kaushambi, NH 24, NH57, NH58, Sahibabad,
Vaishali, Vasundhara, Bhopura
Greater Noida Noida Extension, Yamuna Expressway (Chi 5, TechZone),Bodaki, Eta, Beta,
Knowledge Park, Omnicron, Pi, Surajpur, Swarn nagari, Zeta
Gurugram Dwarka Expressway (Sector 35-37,84, 88, 89, 99,102-113), Golf Course Extension
Road (Gwal pahari, sector 59 - 63, 65), Gold Course Road (Sector 28, 42, 54),
Gurgaon Central, Manesar, New Gurgaon (Sector 76-82,85-93, 95), Old Gurgaon,
Sohna & Sohna Road (Sector 48,67,68), Southern Peripheral Road (Sector 69 - 72)
Noida Noida Expressway (Sector 45, 94, 104, 108, 110, 128, 135, 143,144, 150 - 152, 168),
Yamuna Expressway (Sector 17, 19, 22A 22D,25) , FNG Expressway (Sector 113, 118,
119, 121 ), Dadri Road (Sector 80, 107), Near City Center (Sector 32, 43, 50, 73 - 79)
Geographical spread of report
RESEARCH
City Micro market Prominent localities
Hyderabad Hyderabad West Hitec City, Gachibowli, Manikonda, Narsingi, Serilingampally, Nallagandla
Gachibowli, Kondapur, Chandanagar, Hafeezpet, Bachupally, Miyapur
Hyderabad North Kompally, Tellapur, Kukatpally, Nizampet, Bolarum, Bahadurpally, Shamirpet
Hyderabad South Saidabad, Kismatpur, Maheshwaram, Shadnagar, Rajendra Nagar
Hyderabad East LB Nagar, Nagole, Hayathnagar, Vanasthalipuram, Uppal Kalan, Saroor Nagar
ORR South Bongloor, Shamshabad, Adibatla, Pocharam
Secunderabad Mallapur, Yapral, Sainikpuri, Alwal, AS Rao Nagar
Hyderabad Central Somajiguda, Ameerpet, Himayat nagar, Jubilee Hills, Begumpet, Banjara Hills
Kolkata Kolkata East New Town, Rajarhat, Salt Lake city, Tangra, Beliaghata
Kolkata North Dum Dum, Madhyamgram, Barasat, Barrackpore, Lake Town, Rishra
Kolkata South Baruipur, Behala, Joka, Garia, Narendrapur, Sonarpur, Uttar Gauripur, Tollygunge,
New Alipore, Mukundapur
Kolkata West Serampore, Howrah, Uttarpara Kotrung, konnagar
Kolkata Central Sealdah
Andheri to Dahisar Andheri, Borivali, Dahisar, Goregaon, Jogeshwari, Kandivali, Malad
MetrWorli to Andheri Bandra, Dharavi, Juhu, Khar, Mahim, Santacruz, Ville Parle
Central Mumbai Bandra Kurla Complex, Bhand up, Ghatkopar, Kanjurmarg, Kurla, Matunga, Mulund,
Powai, Sion, Vikhroli
Mumbai South Colaba, Narimat Point, Dadar, Worli, Byculla, Mahalaxmi, Parel, Lower Parel,
Girgaon, Prabhadevi
Mumbai Harbour Sewri, Wadala, Chembur, Mazegaon, Mira Road and Beyond Mira Road, Vasai,
Virar, Nala Sopara, Bhayandar, Boisar, Naigaon East, Palghar
Navi Mumbai Airoli, Belapur, Kharghar, Taloja, Dronagiri, Ghansoli, Karanjade, Ulwe, Vashi, Warai
Thane Thane East & Thane West
Beyond Thane Ambernath, Badlapur, Bhiwandi, Dombivali, Kalyan, Karjat, Neral, Vangani, Ambivali,
Anjurdive, Ulhas Nagar, Shil phata
Panvel and Beyond Panvel, Khopoli, Rasayani, Khalapur, Kewale, Umroli, Pen, Chowk
Pune PCMC Chikhali, Ravet, Wakad, Tathawade, Moshi, Mamurdi, Jambhul, Pimpri, Rahatani,
Gahunje, Chinchwad
Pune South Dhayari, Kondhwa, Undri, Ambegaon Budruk, Phursungi, NIBM Annex
Mohammadwadi, Handewadi, Shirwal, Shivapur, Baramati, Nasrapur, Katraj,
Bibwewadi
Pune West Hinjewadi, Pirangut, Bavdhan, Mahalunge, Baner, Mugawade, Balewadi, Bhukum,
Kothrud, Kamshet, Bhugaon
Pune North Talegaon Dabhade, Alandi, Chakan, Dhanori, Rajgurunagar, Dehu
Nagar Road Wagholi, Kharadi, Lohegaon, Lonikand, Sanaswadi
Pune Solapur Highway Hadapsar, Manjari, Uruli Kanchan, Loni Kalbhor
Mumbai Pune Bypass Vadgaon Budruk, Sus, Warje, Shivane, Karve Nagar
Pune East Mundhwa, Bakhori, Kedagaon, Daund
Pune Center Sopan Baug, Deccan Gymkhana, Parvati Darshan, Shivaji Nagar
Mumbai
Metropolitan
Region
10
Real Insight Residential – April-June 2023
RESEARCH

IRIS Index
JUNE 2021 Edition
Recent Report Publications
July - September 2022
Real Insight (Residential)
Q3 2022
January-March 2023
Real Insight (Residential)
Q1 2023
Residential Realty Consumer
Sentiment Outlook H1 2022
The Silver Economy -
A perspective on senior
living in India 2022
Investment Check -
Land Vs Built-up 2022
Residential Realty Consumer
Sentiment Outlook H2 2021
Housing Price Index
2021
PropTech - The future of
Real Estate in India 2021
Time for Internal
Globalisation 2020
Bricks to Clicks: Smart Homes
in India - A Luxury No More
PropTiger Research is part of PropTiger.com which is owned by Singapore-based Elara Technologies, which also owns Housing.com
and Makaan.com. The Group advises clients ranging from individual owners and buyers to major developers. Backed by strong
research and analytics, our experts provide comprehensive real estate services that cover advertising, marketing, mandating
business solutions for real estate stakeholders, negotiations, home loans, consulting and post-sales service. Headquartered in
Gurugram, Haryana, we have 14 oces across India. For further details about the Company, please visit www.proptiger.com.
PROPTIGER RESEARCH
PROPTIGER RESEARCH
Renuka Kulkarni
Assistant Manager
Research |Growth & Marketing
Housing.com|PropTiger.com|Makaan.com
Yasir Anjum
Associate Creative Manager
Growth & Marketing
Housing.com | PropTiger.com | Makaan.com
yasir[email protected]
GRAPHICS
Kolkata
Anirban Banerjee
Senior Area Head
9593975075
anirban.banerjee@proptiger.com
Bengaluru
Ritesh Negi
City Head
+91 8197981548
ritesh.negi@proptiger.com
Chennai
Kaushik Chaudhary
City Head
+91 9535963101
kaushik.chaudhary@proptiger.com
Ahmedabad
Kamal Chandani
City Head
+91 9099119933
kamal.chandani@proptiger.com
CONTACT OUR KEY EXPERTS
Delhi NCR
Ankit Khanna
City Head
+91 9999422442
ankit.khanna@proptiger.com
Hyderabad
Manikantha Kumar Avvaru
City Head
8008436168
manikantha.kumar@proptiger.com
Mumbai
Nitin Gautam
Regional Business Head – West
+91 9167977324
nitin.gautam@proptiger.com
Pune
Subrato Raha
Senior City Head
+91 9702656221
subrato.raha@proptiger.com
Disclaimer:
Ankita Sood
Director & Head of Research |Growth & Marketing
Housing.com|PropTiger.com|Makaan.com
ankita.sood@proptiger.com
Research Enquiries
Vikas Wadhawan
Chief Financial Officer
REA India & Business Head
Housing.com | PropTiger.com|Makaan.com
vikas.wadhawan@proptiger.com
Business Enquiries
The analysis presented on real estate trends in India are indicative of
market trends. The data has been tracked and collected across eight
cities for nearly 20,000 projects. Utmost care has been taken to provide
the complete market picture however these trends present the best case
scenario and should not be relied upon in anyway. The data for sales is
collected through primary survey carried out by our field agents and the
data for new launches is as per the projects registered under the Real
Estate Regulatory Act (RERA). The report published is for general
information only. Although high standards have been used for analysis in
this report, no responsibility or liability whatsoever can be accepted by
PropTiger.com for any loss or damage resulting from any use of, reliance
on or reference to the content of this document. As a general report, this
material does not necessarily represent the views of PropTiger.com in
relation to particular properties or projects. Reproduction of this report in
whole or in part is nor allowed without prior written approval of
PropTiger.com to the form and content within which it appears.
Download our reports and presentations
at housing.com/research-reports
For more insights and trends reach
out to research@proptiger.com
OR
FOLLOW US ON
Head oce: Echelon Square, Plot No-25, Sector-32, Gurugram
PIN-122001 (Haryana), India | 0124-4866700
RESEARCH RESEARCH
